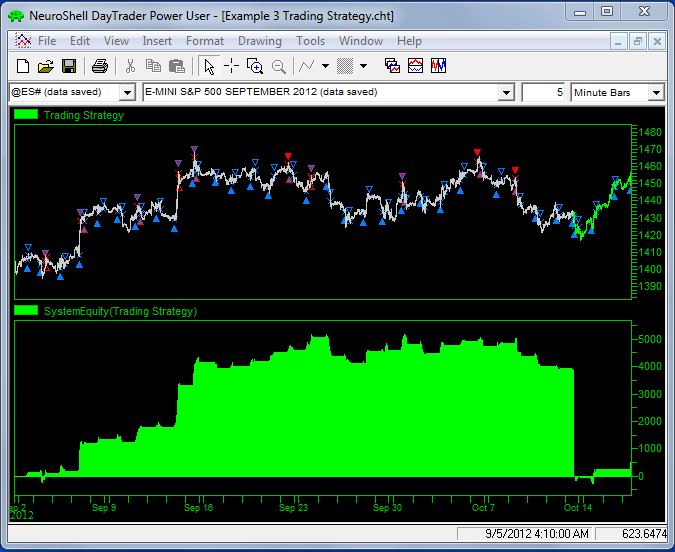
In this example we created a 5 minute chart for the S&P 500 E-Mini which uses InterChart Tools2 high and low values from a 10 minute bar as the basis for creating an RSI Trading Strategy.
We entered a Trading Strategy as follows:
Long Entry: RSI based on TimeBars Low 10 minute < 30
Optimize the number of periods in the RSI from 1 to 10 and optimize the RSI value from 15 to 45
Short Entry: RSI based on TimeBars High 10 minute > 70
Optimize the periods in the RSI from 1 to 10 and optimize the RSI value from 80 to 90
We set the model to trade between the hours of 8:35 a.m. to 3:30 p.m. We added a margin of $500 and a point value of $50 for the S&P E-Mini. The model returned an annual return on account of 5603.3% in the out-of-sample period compared to a 115.4% annual percent change in price.