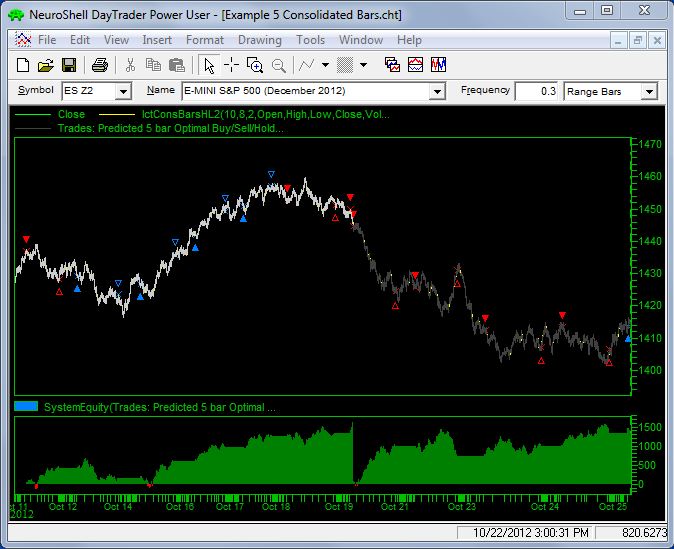
We created a .3 range bar chart for the S&P 500 E-Mini, then created a Prediction with both a Consolidated Bars HL2 indicator and a Linear Weighted Average of the Close as inputs. On tick based charts (range and volume) these consolidated bars act like variable time bars.
In this example, a 5 bar consolidate of a .3 range bar will display the (H + L) / 2 over the time it took to create the 5 bars. These bars are continuous and always reflect the high of the previous N bars, so as a new bar is added the oldest bar is dropped off. Unlike any moving average which might attempt to do the same, there is never any lag.
The Prediction predicted 5 0.3 range bars into the future from the next open. The model used a $500 margin and a point value of $50. We set the number of hidden neurons down to 1.
The profitable results from the optimization period continued into the out-of-sample period.