There are 8 "fuzzy (verb) rule" indicators in the add-on, Fuzzy1, Fuzzy2, ... , Fuzzy8. Fuzzy1 handles "1 segment" rules such as "close rises" or "open drops sharply". Fuzzy2 handles "2 segment" rules such as "close rises, then drops sharply". Fuzzy3 is for "3 segment" rules such as "open rises, then drops, then remains steady", etc. The internal fuzzy logic engine parameters in this group of indicators are hidden from the user and fixed at some reasonable default values. The Fuzzy Indicator output ranges from zero to one showing how close the current input time series matches your pattern. One means a perfect match; zero means no match at all.
Parameters Input Time Series - the time series under consideration. It can be any price series such as the close of a stock or other issue, or any technical indicator such as RSI, MACD, etc. There is only one input time series in Fuzzy Indicators.
Code1, Code2, …, CodeN - the search pattern rules. You define the search pattern rules as a sequence of numeric tokens. Each token represents a specific rule applied to a segment. The token-to-rule translation is as follows: 2 - rises sharply 1 - rises 0 - remains steady -1 - drops -2 - drops sharply Code1 corresponds to the earliest segment, CodeN - to the most recent segment in the input time series. For example, you want to find the pattern verbally described as "the close rises sharply, then stays steady, then drops sharply". Using the coding scheme above such pattern will be coded as Code1=2, Code2=0, Code3=-2. If using Fuzzy Indicators in a trading strategy, you may want to let the genetic optimizer find the best rules. Set the range of variation of Code parameters to -2 … 2.
Segment Size - the number of bars in the segment. All segments have the same number of bars. The segments share their edge bars. In other words, the last bar in a previous segment is also the first bar in the segment immediately following that segment. Default segment size value is 5. Minimum setting is 2. If using Fuzzy Indicators in a trading strategy, you may want to let the genetic optimizer find the best segment size. Possible range of variation could be from 2 to 100 bars.
Max Change - the absolute value of the maximum change of the time series in the segment. The maximum change is needed to define the highest "rise sharply" rule or absolute value of the "drops sharply" rule. For example, if Max Change=3 (default value) and Segment Size=5 bars, then the strongest "rise sharply" rule occurs if the 5-bar time series rise is 3 or more points. If the rise is in between 0 and 3 points, then that rise will be classified as different degrees of the "rise sharply", "rise", or "stays steady" rules depending on the actual value. The same logic applies to drops. Given numbers above, the strongest "drops sharply" rule occurs if the 5-bar time series drop is 3 or more points. If the drop is in between 0 and 3 points, then that drop will be classified as different degrees of "drop sharply", "drop", or "stays steady" rules depending on the actual drop value. As another example, let’s examine how a change of 3 in the time series will be considered in a Fuzzy Indicator with two different values of Max Change. If Max Change is set to 3, then an actual change of 3 will be considered the strongest form of "rises sharply". On the other hand, if Max Change is set to 6, then an actual change of 3 in the time series is at most a weak "rises sharply", however it will be considered a strong "rises". This leads us to the following important note: The Max Change parameter setting is critical to the Fuzzy Indicator output. Its setting defines what you mean by the "rise sharply", "rise", etc. rules. It should be set to a value most likely anticipated when considering the time series change on the Segment Size bars time scale across the WHOLE time series. Every time you change the Segment Size parameter, the Max Change should be adjusted accordingly. The easiest way to set the Max Change is to use the Fuzzy Indicators in a trading strategy with parameter optimization. Let the genetic optimizer find the best Max Change value. The genetic optimization option is available in either the NeuroShell Trader Professional or the NeuroShell DayTrader Professional.
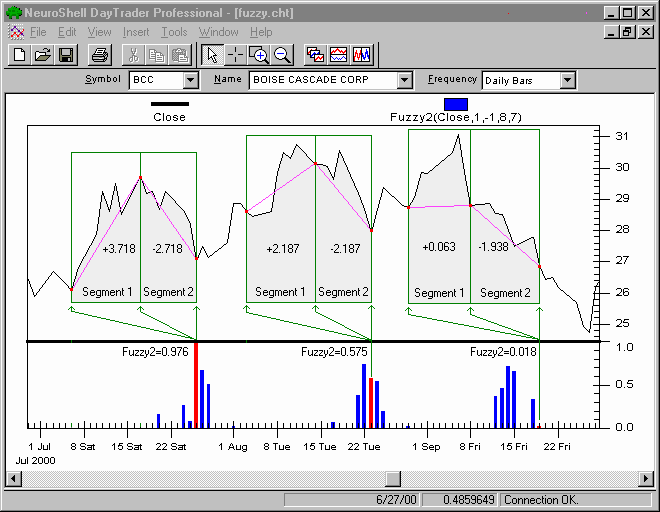
Figure 1. Example of the Fuzzy2 indicator output (bar chart at the bottom). The search rule is "Close rises, then drops", Segment Size=8 bars, and Max Change=7.
Figure 1 was produced from the Fuzzy Example 1.cht chart file found in the NeuroShell Trader\Fuzzy Example folder.
Three different cases are highlighted in red in Figure 1. First case, Fuzzy2=0.976 on July 26, is almost a perfect match because given Max Change=7, the Close rise of 3.718 in Segment 1 and Close drop of 2.718 in Segment 2 both very well translate into verbal "rise" and "drop" rules. The third case, Fuzzy2=0.018 on September 19, is almost no match at all. The red bar is hardly visible on the chart. The Close rises in segment 1 just 0.063 points, what for Max Change=7 is a perfect "stays steady" situation, and then drops 1.938 points in segment 2, what is a weakening "drop" situation. Indeed, this pattern is much more likely to be described by a human expert as a "Close remains steady, then drops" pattern than a "Close rises, then drops" pattern. The second case, Fuzzy2=0.575 on August 23, is an intermediate case between those two above. It is still a "rise-drop" pattern but on the edge to be described as such. A little less rise in segment 1 and/or a little less drop in segment2 will make this pattern less likely to be named as the "rise-drop" pattern. The following two bars on 24th and 25th clearly show that.
|