Take your trading to another level when you purchase add-ons that let you apply everything from sophisticated indicators and advanced neural network architectures to John Ehler’s MESA9 frequency and phase analysis
Adaptive Net Indicators - neural nets especially adapted to pattern recognition, some of which automatically include lags of inputs. Useful for building your own adaptive moving averages.
Adaptive Turboprop 2- like the neural nets in the Prediction Wizard, but they operate like an indicator and automatically retrain themselves. You can optimize training set size, walkforward interval, number of hidden neurons, and even the lookahead period.
Advanced Indicator Set 1 - a set of indicators that users requested including chaos indicators, an indicator that gives the phase of the moon, and curvefitting trendline indicators.
Advanced Indicator Set 2 - our second set of users requested indicators including indicators by Marc Chaikin and J. Welles Wilder, Redundant Haar Wavelets, Flag Indicators, Bar/Condition Count Indicators, and other Miscellaneous Indicators
Advanced Indicator Set 3 - an eclectic set of indicators that expand NeuroShell Trader's ability to find a value between two separate conditions or since the occurrence of a single condition. In addition, Set 3 adds the power to count, remember or toggle values off and on based on conditions. These functions complement the NeuroShell Trader's emphasis on building indicators with a wizard rather than requiring the user to be a programmer. The result is a significant speed increase in building and testing trading rules.
Cluster Indicators - like the neural indicators, these give a buy or sell probabilities (the probability that your issue is a buy or sell opportunity), but they work by clustering instead of using a neural net.
Fuzzy Pattern Recognizer - Lets you describe patterns in which you are interested, and then tells you when these patterns appear. Uses fuzzy logic to find the patterns, so it can tell you when a pattern is "like" the one you are seeking.
Fuzzy Sets - With Fuzzy Sets the user can instruct NeuroShell with
functions
equivalent to
fuzzy statements
like:
"Buy when the Stochastic %K indicator is very high, and the Commodity Channel Index is high, and the spread
between two moving averages is low."
Neural Indicators - classification neural nets that give you the probability that the current situation is a buy or sell opportunity. These nets don't predict any price, they give you a direct buy/sell probability. Some of them are "recurrent nets" that automatically look back in time.
Pattern Matcher - a set of indicators based on the concept of finding patterns, past or present, in a time series, and the subsequent activity that occurred after it.
Turning Points - a set of indicators based on the concept of finding local peaks and valleys in a price series.
Click here for a comparison matrix of the neural network Add-ons
Ehlers' book develops and demonstrates effective new trading tools through the application of modern DSP techniques. "These tools have proven in real-time use to consistently provide traders with razor-sharp buy and sells in virtually any market--meeting or exceeding the performance of commercial black box trading products which cost hundreds or even thousands of dollars," according to Ehlers.
Modernizing popular trading procedures to take advantage of the incredible computing speed and power available to today's trader, Ehlers introduces:
. The Fisher Transform--ensure that the density function of any indicator is Gaussian, creating sharper trade indicators.
. The Relative Vigor Index--a responsive oscillator in which movement is normalized to the trading range of each bar
. Improved Hilbert Transform--a more responsive method to accurately measure market cycles
. The Sinewave Indicator--a non-causal filter that gives entry and exit indicators 1/16 of a cycle period in advance of the turning point
. The Laguerre Transform--a new tool to address the smoothing versus lag problem more effectively and create better smoothing filters
. Super Smoothing Filters--provide more smoothing with less lag
. Simple Moving Average Computations--two new ways to compute the simple moving average with unprecedented ease
"Advances made in computer technology in the past two decades have clearly outpaced advances in trading software and practice. Cybernetic Analysis for Stocks and Futures seeks to restore the balance between computational power and user proficiency," according to Ehlers. "Combining new indicators with tested indicators for forecasting stock and futures markets with surgical precision, it will drive your trading to new levels of predictive accuracy, trading effectiveness, and overall profitability."
NeuroShell Trader Professional and DayTrader users can further enhance Ehlers' work by combining his indicators with the power of the NeuroShell Trader's optimizer to produce trades with a winning edge.
The Cybernetic Analysis add-on is available now and costs $399 by Internet download. Although there is a help file with the add-on to assist with mechanics, the add-on is a companion to the book, and the theory and usage of the indicators are explained only in the book. You should not purchase the add-on without purchasing the book, which at this writing is discounted 32% to $54.37 at Amazon.com.
The Cybernetic Analysis add-on contains the following indicators from the book:
Price - returns the average of the high and low values for the bar. Ehlers uses this value in most of his indicators when he is referring to a price data stream.
Cyber1_FisherTransform - Ehlers' describes the Fisher Transform as a mathematical process that converts a data set to one with a Gaussian Probability Density Function (PDF). This indicator is described in Chapter 1. It may be combined with the FisherTransformTrigger indicator to create a trading system.
Cyber1_FisherTransformTrigger - The FisherTransformTrigger indicator is created by delaying the FisherTransform indicator by one bar. The FisherTransformTrigger indicator may be combined with the Fisher Transform indicator to create a trading system.
Cyber3_ITrend - This is the Instantaneous Trendline indicator described in Chapter 3. According to Ehlers, "having an Instantaneous Trendline with zero lag is a good beginning to generate a responsive trend-following system." This indicator may be used with the Cyber3_ITrendTrigger indicator to create a trading system.
Cyber3_ITrendTrigger - This is the Instantaneous Trendline Trigger described in Chapter 3. This is a leading indicator that is created by adding a two-day momentum of the Instantaneous Trendline to the Instantaneous Trendline itself. This indicator may be used with the Cyber3_ITrend indicator to create a trading system.
In order to incorporate a limit price for the ITrend crossover condition and no limit for the emergency exit condition which uses the RevPct (Reverse Percentage), this add-on contains three additional indicators not included in Ehlers' book. Ehlers' Trading Strategy is built into these indicators:
Cyber3TSLimit - Cyber3TSLimit is used in conjunction with Cyber3TSPosition and Cyber 3TSSign.
Cyber3TSPosition - Cyber3TSPosition is used in conjunction with Cyber3TSLimit and Cyber 3TSSign.
Cyber3TSSign - Cyber3TSSign is used in conjunction with Cyber3TSPosition and Cyber 3TSLimit.
Cyber4_Cycle - This is the Cyber Cycle indicator described in Chapter 4. This is an indicator that isolates the cycles in data with additional smoothing. It may be used with the Cyber4_CycleTrigger indicator to create a trading system.
Cyber4_CycleTrigger - This is the Cyber Cycle Trigger indicator described in Chapter 4. The Trigger indicator is created by delaying the Cyber Cycle indicator by one bar. It may be used with the Cyber4_Cycle indicator to create a trading system.
Cyber5_CG - This is the Center of Gravity (CG) oscillator indicator described in Chapter 5. Ehlers describes this smoothed, zero lag indicator as useful for identifying turning points. It may be combined with the Cyber5_CGTrigger indicator to create a trading system.
Cyber5_CGTrigger - This is the Center of Gravity Trigger (CG Trigger) oscillator indicator described in Chapter 5. The Trigger indicator is created by delaying the Center of Gravity indicator by one bar. It may be combined with the Cyber5_CG indicator to create a trading system.
Cyber6_RVI - This is the Relative Vigor Index (RVI) indicator described in Chapter 6. This indicator measures the up and down strength of the market normalized to the trading range. It may be combined with the Cyber6_RVITrigger to create a trading system.
Cyber6_RVITrigger - This is the Relative Vigor Index Trigger (RVI Trigger) indicator described in Chapter 6. The Trigger indicator is created by delaying the Relative Vigor Index indicator by one bar. It may be combined with the Cyber6_RVI to create a trading system.
Cyber8_StochasticRSI - This is the StochasticRSI indicator described in Chapter 8. This indicator is a ratio of up prices compared to the sum of up and down prices, and the stochastic portion looks at the highs and lows over the same period. It may be combined with the Cyber8_StochasticRSITrigger indicator to create a trading system.
Cyber8_StochasticRSITrigger - This is the StochasticRSI Trigger indicator described in Chapter 8. The Trigger indicator is created by delaying the StochasticRSI indicator by one bar. It may be combined with the Cyber8_StochasticRSI indicator to create a trading system.
Cyber8_StochasticCycle - This is the Stochastic Cyber Cycle indicator described in Chapter 8. It adds the stochastic component of examining the highs and lows to the Cyber Cycle indicator from Chapter 4. It may be combined with the Cyber8_StochasticCycleTrigger indicator to create a trading system.
Cyber8_StochasticCycleTrigger - This is the Stochastic Cyber Cycle Trigger indicator described in Chapter 8. The Trigger indicator is created by delaying the StochasticCycle indicator by one bar. It may be combined with the Cyber8_StochasticCycle indicator to create a trading system.
Cyber8_ StochasticCG - This is the Stochastic Center of Gravity (CG) indicator described in Chapter 8. It adds the stochastic component of examining the highs and lows to the Center of Gravity indicator from Chapter 5. It may be combined with the Cyber8_StochasticCGTrigger indicator to create a trading system.
Cyber8_StochasticCGTrigger - This is the Stochastic Center of Gravity Trigger (CG Trigger) indicator described in Chapter 8. The Trigger indicator is created by delaying the StochasticCG indicator by one bar. It may be combined with the Cyber8_StochasticCG indicator to create a trading system.
Cyber8_StochasticRVI - This is the Stochastic Relative Vigor Index (RVI) indicator described in Chapter 8. It adds the stochastic component of examining the highs and lows to the Relative Vigor Index from Chapter 6. It may be combined with the Cyber8_StochasticRVITrigger indicator to create a trading system.
Cyber8_StochasticRVITrigger - This is the Stochastic Relative Vigor Index Trigger (RVI Trigger) indicator described in Chapter 8. The Trigger indicator is created by delaying the StochasticRVI indicator by one bar. It may be combined with the Cyber8_StochasticRVI indicator to create a trading system.
Cyber8_FisherCycle - This is the Fisher Cyber Cycle indicator described in Chapter 8. Ehlers adds the Fisher Transform to the Cyber Cycle indicator from Chapter 4 to produce sharper, better defined entry and exits. This indicator may be combined with the Cyber8_FisherCycleTrigger indicator to create a trading system.
Cyber8_FisherCycleTrigger - This is the Fisher Cyber Cycle Trigger indicator described in Chapter 8. The Trigger indicator is created by delaying the Fisher Cycle indicator by one bar. This indicator may be combined with the Cyber8_FisherCycle indicator to create a trading system.
Cyber8_FisherCG - This is the Fisher Stochastic CG indicator described in Chapter 8. Ehlers adds the Fisher Transform to the Center of Gravity indicator from Chapter 5 to produce sharper, better defined entry and exits. This indicator may be combined with the Cyber8_FisherCGTrigger indicator to create a trading system.
Cyber8_FisherCGTrigger - This is the Fisher Stochastic CG Trigger indicator described in Chapter 8. The Trigger indicator is created by delaying the Fisher Stochastic CG indicator by one bar. This indicator may be combined with the Cyber8_FisherCG indicator to create a trading system.
Cyber8_FisherRVI - This is the Fisher Stochastic Relative Vigor Index (Fisher RVI) indicator described in Chapter 8. Ehlers adds the Fisher Transform to the Relative Vigor Index indicator from Chapter 6 to produce sharper, better defined entry and exits. This indicator may be combined with the Cyber8_FisherRVITrigger indicator to create a trading system.
Cyber8_FisherRVITrigger - This is the Fisher Stochastic Relative Vigor Index Trigger (Fisher RVI Trigger) indicator described in Chapter 8. The Trigger indicator is created by delaying the Fisher Stochastic RVI indicator by one bar. This indicator may be combined with the Cyber8_FisherRVI indicator to create a trading system.
Cyber9_Period - This is the Cycle Period indicator described in Chapter 9. It may be used to measure the Dominant Cycle period.
Cyber10_AdaptiveCycle - This is the Adaptive Cyber Cycle indicator described in Chapter 10. This indicator enables the Cyber Cycle indicator from Chapter 4 to be adaptive to the measured Dominant Cycle period. This indicator may be combined with the Cyber10_AdaptiveCycleTrigger indicator to create a trading system.
Cyber10_AdaptiveCycleTrigger - This is the Adaptive Cyber Cycle indicator described in Chapter 10. The Trigger indicator is created by delaying the Adaptive Cyber Cycle indicator by one bar. This indicator may be combined with the Cyber10_AdaptiveCycle indicator to create a trading system.
Cyber10_AdaptiveCG - This is the Adaptive Center of Gravity (CG) indicator described in Chapter 10. This indicator enables the Center of Gravity indicator from Chapter 5 to be adaptive to the measured Dominant Cycle period. This indicator may be combined with the Cyber10_AdaptiveCGTrigger indicator to create a trading system.
Cyber10_AdaptiveCGTrigger - This is the Adaptive Center of Gravity Trigger (Adaptive CG Trigger) indicator described in Chapter 10. The Trigger indicator is created by delaying the Adaptive CG indicator by one bar. This indicator may be combined with the Cyber10_AdaptiveCG indicator to create a trading system.
Cyber10_AdaptiveRVI - This is the Adaptive Relative Vigor Index (Adaptive RVI) indicator described in Chapter 10. This indicator enables the Relative Vigor Index from Chapter 6 to be adaptive to the measured Dominant Cycle period. This indicator may be combined with the Cyber10_AdaptiveRVITrigger indicator to create a trading system.
Cyber10_AdaptiveRVITrigger - This is the Adaptive Relative Vigor Index Trigger (Adaptive RVI Trigger) indicator described in Chapter 10. The Trigger indicator is created by delaying the Adaptive Relative Vigor Index indicator by one bar. This indicator may be combined with the Cyber10_AdaptiveRVI indicator to create a trading system.
Cyber11_Sine - This is the Sinewave indicator described in Chapter 11. This indicator may be used to predict the turning point of market cycles. It is plotted as the sine of the phase angle of the Dominant Cycle. It may be used in conjunction with the Cyber11_LeadSine indicator to create a Trading Strategy.
Cyber11_LeadSine - This the LeadSine indicator described in Chapter 11. It is plotted as the sine of the phase angle of the Dominant Cycle plus 45°. It may be used on conjunction with the Cyber11_Sine indicator to create a Trading Strategy.
Cyber12_Adaptive Momentum - This is the Smoothed Adaptive Momentum indicator described in Chapter 12. This indicator measures the Dominant Cycle period and uses that measurement to compute a one-cycle momentum.
Cyber13_2PoleButterworth - This is the Two Pole Butterworth Filter described in Chapter 13. Ehlers introduces Butterworth filters as better filters than exponential moving averages.
Cyber13_3PoleButterworth - This is the Three Pole Butterworth Filter described in Chapter 13. Compared to the Two Pole Butterworth Filter, this one increases the sharpness of the filter rejection.
Cyber13_2PoleSuperSmoother - This is the Two Pole Super Smoother described in Chapter 13. This filter has less lag than the 2PoleButterworthFilter.
Cyber13_3PoleSuperSmoother - This is the Three Pole Super Smoother described in Chapter 13. Compared to the Two Pole Super Smoother, this one increases the sharpness of the filter rejection.
Cyber14_LaguerreFilter - This is the Laguerre Filter described in Chapter 14. Ehlers describes this filter as a balance between smoothing and lag in order to avoid whipsaw trades.
Cyber14_LaguerreRSI - This is the Laguerre Relative Strength Index (RSI) Indicator described in Chapter 14. Ehlers shows that you can apply the Laguerre Filter to familiar indicators.
Cyber16_NetLead - This is the leading indicator called NetLead described in Chapter 16. This indicator combines a leading indicator with an exponential moving average to show when the market is in an uptrend or a downtrend.
CyberCycleInverseFisher - This is the Inverse Fisher Transform indicator described in the Ehlers' article of the same name that appeared in the May 2004 issue of Technical Analysis of STOCKS AND COMMODITIES magazine. He describes this indicator as an oscillator that produces clear buy and sells.
The following are NeuroShell Trader Example charts included with the Cybernetic Analysis add-on:
Example Chapter 3 ITrend No Limit This chart builds a Trading Strategy based on the crossover of the ITrend and ITrend Trigger indicators from Chapter 3.
Example Chapter 3 ITrend Limit Intel This chart builds a Trading Strategy based on the crossover of the ITrend and ITrend Trigger indicators from Chapter 3. This chart incorporates a limit price for the crossover condition.
Example Chapter 4 Cyber Cycle This chart uses a crossover of an indicator to generate a trade indicator.
Example Chapter 4 Cyber Cycle Opt HD This chart uses a crossover of an indicator to generate trades. This chart is optimized on Home Depot (HD). Results are improved from the unoptimized chart named Chapter 4 Cyber Cycle.
Example Chapter 4 Cyber Cycle Opt Intel This chart uses a crossover of an indicator to generate trades. This chart is optimized on Intel and includes an evaluation period of 6 months in the Trading Strategy.
Example Chapter 4 Cyber Cycle Opt Deere This chart uses a crossover of an indicator to generate trades. This chart is optimized on Deere and includes an evaluation period of 6 months in the Trading Strategy.
Example Chapter 10 Adaptive RVI This chart builds a Trading Strategy by using a crossover of the Adaptive RVI and Adaptive RVI Trigger. This is typical of many of the Trading Strategies Ehlers builds with indicators described in the book.
Example Chapter 10 Adaptive RVI Opt This chart builds a Trading Strategy by using a crossover of the Adaptive RVI and Adaptive RVI Trigger. This optimized version of the Chapter 10 Adaptive RVI chart produces more profit than the original.
Example Chapter 12 Adaptive Trend This chart builds a Trading Strategy for the Swiss Franc by using a crossover of the Adaptive Momentum indicator and 0.
Example Chapter 12 Adaptive Trend Opt SF This chart builds a Trading Strategy for the Swiss Franc by using a crossover of the Adaptive Momentum indicator. This chart is optimized to increate profit.
Example Chapter 12 Adaptive Trend Multiple Stocks Opt This chart builds a Trading Strategy for the multiple stocks by using a crossover of the Adaptive Momentum indicator. This chart is optimized to increase profit.
Example Chapter 12 Adaptive Trend Opt Dell This chart builds a Trading Strategy for Dell by using a crossover of the Adaptive Momentum indicator. This chart is optimized to increase profit.
For more details, please view the product manual for this add-on
BUY NOWJohn Ehlers has once again broken new ground applying scientific methods to market data with the release of the MESA91 indicators for NeuroShell Trader. The MESA91 indicators measure whether the market is in cycle or trending mode and deliver precise trading for either situation. The new version includes an adaptive method of extracting the dominant cycle for each instrument and an EvenBetterSine indicator that can forecast market trend in only a half period of the dominant cycle. Each indicator now includes parameters for setting the Lowest and Highest Period of the cycle, and these parameters may be optimized in NeuroShell Trader.
Ehlers is a world renowned expert in applying scientific principles and DSP technology to the art of technical trading. According to Ehlers, a simplified model of the market consists of the combination of a trend and a cycle. Since the cycle period is known, it can be removed from the data to expose the underlying trend. The market is best traded using oscillator-type indicators when it is in a cycle mode and is best traded using moving average-type indicators when it is in trend mode. The MESA91 collection of indicators is not only dynamically adjusted by the dominant cycle, but advanced DSP techniques are used to produce low lag and non-causal values in time to give users a trading advantage. The MESA91 add-on is a joint project between Mesa Software, Inc. and Ward Systems Group, Inc. Mesa developed the theory and programming and Ward Systems is selling the add-on for use with NeuroShell Trader. MESA91 requires NeuroShell Trader release 6.3. The price is $499.00.
MESA91 is as easy to use as any of the indicators built into NeuroShell Trader.Indicators
MESA91 Adaptive CCI, RSI and Stochastic
The MESA91_Adaptive_CCI is similar to their conventional Indicators except that it is tuned to the full
MESA-measured Dominant Cycle period. The same is true for the MESA91 Adaptive RSI and Adaptive
Stochastic indicators included in the set.
MESA91 Bandpass
The MESA91_Bandpass Indicator is a bandpass filter tuned to the MESA-measured Dominant Cycle. Its
amplitude is plotted to reflect the cyclic swing of the input time series. The MESA91_Bandpass filter
removes both low frequency and high frequency components from the input time series. The Delta parameter
is the bandwidth of a bandpass filter in terms of +/- fraction of the Dominant Cycle. A smaller number
gives a narrower bandwidth to eliminate extraneous cycle components and a larger number gives a wider
bandwidth to improve responsiveness to transients.
MESA91 BandStop
The MESA91_BandStop Indicator removes the Dominant Cycle component from the time series while retaining
cyclic components that are both longer and shorter than the Dominant Cycle.
MESA91 Detrend
The MESA91_Detrend Indicator subtracts a trendline from the time series and displays the difference
scaled to the plus and minus one standard deviation from that trendline. This display enables an easy
estimation when a swing peak or valley is reached and therefore a higher probability of reversion to the
mean.
MESA91 Dominant Cycle
This indicator displays the MESA-measured Dominant Cycle. The Dominant Cycle can be used to dynamically
tune other indicators to maintain consistency with changing market conditions.
MESA91 Sine and LeadSine
The problem with virtually all indicators is that they are causal. That means they directly depend on
data for their computation. As a result, the computation cannot be accomplished until after the data
arrives, and - as a result - all causal indicators have lag. Lag is perhaps the traders' worst enemy,
particularly when trading the cycle mode when relatively short term entries and exits are expected.
MESA91 offers a solution to the lag problem by offering the MESA91_Sine and MESA91_LeadSine indicators.
The market is coherent in the cycle mode, meaning that the Dominant Cycle has existed for a short while
in history. It is further assumed that the dominant cycle will continue for a short time into the
future. Since the dominant cycle is known, and its phase can be computed, we can advance time by
advancing phase of the coherent dominant cycle. The MESA91_LeadSine Indicator is computed simply by
advancing the phase of the dominant cycle by 45 degrees. This creates an indicator that produces a
crossing value 1/8th of a cycle ahead of its turning point, indicated by the MESA91_Sine Indicator. For
an 16 bar cycle, the crossing occurs 2 bars ahead of the cyclic turning points - just right for making a
timely trade entry. Clearly, the MESA91_Sine and MESA91_LeadSine indicators do not work so well when the
market is in a trend mode.
MESA91 EvenBetterSine
The MESA91_EvenBetterSince Indicator can forecast market trend and it does so in only a half period of
the dominant cycle, compared to the Sine indicator, which requires the full dominant cycle before it can
determine market trend.
The original Sine indicator correlates a pure sinewave with the phase of input cycle (or dominant cycle in MESA91) over a full cycle period. This completely removes any trend component and only gives the cycle inherent in the data. The disadvantage of this indicator is that sometimes the cyclic swing is so small that the dominant cycle data is inconsequential. This is particularly true when the market is in a trend. On the other hand, the EvenBetterSine correlates the data with a sinewave over a HALF period of the dominant cycle.
MESA91 Smooth
MESA91_Smooth is an adaptive 2 Pole Super Smoother Filter that is tuned to a fraction of the
MESA-measured Dominant Cycle. The degree of smoothing is altered by the Mult input parameter, which is
the fraction of the Dominant Cycle to which the filter is tuned.
MESA91 SNR
MESA91_SNR measures the Signal-to-Noise Ratio in the price data in decibels. “Noise” is the average
daily price range (High – Low) taken over the period of the MESA-measured Dominant Cycle. This
definition may not be strictly true, but it suffices as a qualifier of uncertainty of the intraday
prices. For the purpose of this indicator, the value is the peak-to-peak amplitude of the Dominant Cycle.
When the wave amplitude of the value is twice the Noise amplitude the SNR has a value of 6 dB. This
ratio is the threshold below which it is not advisable to swing trade on the basis of cycles.
MESA91 TrendLine
MESA91_TrendLine is an adaptive 2 Pole Super Smoother Filter that is tuned to a multiple of the
MESA-measured Dominant Cycle, assuring that all cyclic components shorter than the Dominant Cycle will
be attenuated. This results in an indication of the trend. The degree of lag produced by the
MESA91_TrendLine Indicator is controlled by the Mult input parameter, which is the multiple of the
Dominant Cycle to which the filter is tuned.
MESA91 TrendVigor
The MESA91_TrendVigor Indicator measures the slope of the time series across the period of the Dominant
Cycle as a ratio to the peak-to-peak amplitude of the Dominant Cycle. If the ratio is greater than one,
then the uptrend is swamping the Dominant Cycle and it is not advisable to use the Dominant Cycle for
swing trading.
The MESA91 indicator set includes eight example charts that you can examine inside of NeuroShell Trader.
For more details, please view the product manual for this add-on.
Background
For any dataset and trading methodoligy combination there is only one ideal volatility. That doesn't mean that you have a guarantee of profit. It just means that at some level of volatility, your trading methodoligy will deliver its best performance.
Generally, if the volatility gets too wild, your model can't cope. Your system will indicate a trade but the direction will change so quickly that you can't profit. On the other end of the scale, price is moving so slowly and minimally that there is a balance between the bulls and bears and the balance lacks conviction on both sides. The chart is waiting for one of them to get tired and back off. Then the issue will move but the direction will be set by chance.
You may observe that price volatility and volume volatility have a probable relation with time of day (or day of the month) as well as each other. How to you incorporate that relationship into your Trading Strategy?
The Solution: The TradeGate Add-on
To tilt the odds in your favor Richey Enterprises has created the InterChart Tools TradeGate indicators. These indicators can determine when to restrict or allow trades for your individual trading system. You can use them in both predictions and Trading Strategies.
The Add-on includes:
How TradeGate Works
Step 1: Build Your Basic System
The initial trading rules are as follows:
Long Entry: Buy Long when RSI < 30
Short Entry: Cover Short when RSI < 70
Step 2: Find Dates When RSI Trading Strategy Should Not Trade
To eliminate dates when trading is not favorable for this RSI Trading System, we locked the RSI rule and parameters from the original RSI Trading Strategy and added a Restrict Trades by Date indicator to the Long and Short Entry tabs of the Trading Strategy wizard. The setup is displayed below.
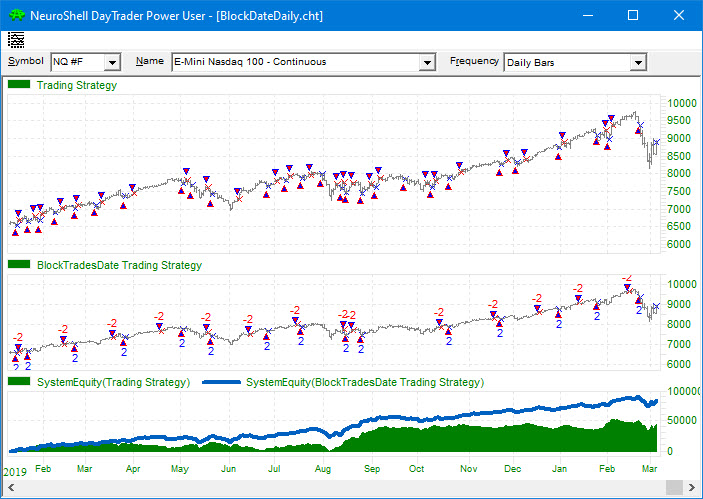
Below are the final trading rules for the combination system. Note that the Trader's optimizer eliminated the Restrict Trades by Date Rule for Long Entries, but kept the Restrict for Short Entries.
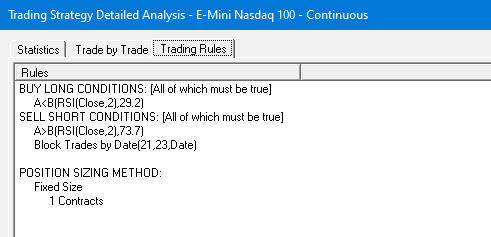
The combination of the RSI Trading rules and the Restrict Trades by Date indicators produced a net profit of $83,315 compared to $43,551 for the original RSI trading system.
The Trading Strategies and equity curves for both are displayed in the chart below.
The InterChart Tools TradeGate Add-on includes six example charts, including the chart described above.
To learn more about how you can incorporate the TradeGate indicators into your trading, CLICK HERE to read the the product manual for this add-on.
The price of InterChart Tolls TradeGate Add-On is $399. You need NeuroShell Trader 7.0 or higher to use the InterChart Tools TradeGate Add-On. InterChart Tools TradeGate work with the NeuroShell® DayTrader and NeuroShell DayTrader® Power User, as well as NeuroShell Trader Professional and NeuroShell Power User. For more information, call Ward Systems Group at 301 662 7950.
BUY NOWThe Japanese developed Renko bar charts in an attempt to show price based upon a specified amount of movement in a single direction rather than reporting price based on a time schedule as in a 5 minute bar chart. Richey Enterprises developed an entirely new concept in Renko bars - optimizable Renko bars based on price, volume, or a combination of both, that may be customized for each security. The result is that your trading is based on less noise and subsequently generate more precise trading. These innovative Renko Bars comprise the InterChart Tools Renko Bars Add-On for NeuroShell Trader.
The InterChart Tools Renko Bars are virtual bars capable of generating trades and performing their calculations using the same methods as traditional bars. Once a trade is generated by the Renko bar, both the trade and fill are correctly displayed on the open of the next bar of the base chart. For example, you can create a 0.25 range bar base chart and then add InterChart Tools Renko Bars to trading rules, visual charting, or predictions.
Included Indicator Types
How Renko Bars Work
Renko Bars are only created when price has moved either up or down by the amount of the specified high-low range. This amount is referred to as the brick size. In all classic Renko charts, all bricks must be exactly the same size and the change specified in the high-low range must be in the same direction, either up or down, before a new bar is formed.
Why InterChart Tools Renko Bars Differ from Traditional Renko Bars
The InterChart Tools Renko Bars include parameters that allow you to specify the number of ticks used to calculate the up part of the Renko bar as well as the number of ticks used to compute the down part. Since any bar's function is to absorb noise and rising price jitter is often different from falling price jitter, the IctRenko bars permit an asymmetrical definition to accommodate this. A Bar Size Multiplier gives you the option of setting the overall size of the bar once the up/down ratio has been configured. IctRenko bars are only created when price has moved either up or down by the number of virtual ticks specified in either the Ticks per Up Bar or Ticks per Down Bar multiplied by the Bar Size Multiplier. NeuroShell Renko bars may, at the user's discretion, be controlled by the NeuroShell Trader optimizer to identify the optimal bar size and noise absorption for a given trading methodoligy or security.
 Different moving averages of InterChart Tools Volume Renko Bars can tell you when to go long or short - or
even when to stay out of the market.
Different moving averages of InterChart Tools Volume Renko Bars can tell you when to go long or short - or
even when to stay out of the market.For more details, please view the product manual for this add-on.
The price of InterChart Tolls Renko Bars Add-On is $695. You need NeuroShell Trader 6.4x or higher to use the InterChart Tools Renko Bars Add-On. InterChart Tools Renko Bars work with the NeuroShell® DayTrader and NeuroShell DayTrader® Power User, as well as NeuroShell Trader Professional and NeuroShell Power User. For more information, call Ward Systems Group at 301 662 7950.
BUY NOWStreams may be sent or received from any of NeuroShell DayTrader Professional chart types: time bar, volume bar, tick bar, and range bars. Because InterChart Tools 1 works with daily, monthly, and weekly charts, it may also be used with NeuroShell Trader and NeuroShell Trader Professional.
Single Streams
InterChart Tools 1 broadcasts “data streams” from a source chart, which can be retrieved by one or more
receiving charts. These streams are time series chart items. Any time series which can be plotted on a chart can
be sent to another chart using the SendStream and GetStream indicators respectively.
Items that may be sent to another chart include:
Groups of Streams
In addition to transmitting single data streams, InterChart Tools 1 includes “SendGroup” indicators which allow
you to send similar data from either single or multiple charts. The multiple streams are processed (summed, min
value, max value, or averaged) and displayed on another chart as a single data stream using the GetGroup
indicator.
Volume Indicators
Volume data may be transmitted from a stock chart to an options or futures chart using the SendVolume and
GetVolume indicators. The SendVolume indicator is different from the SendStream indicator because it accumulates
data until the completion of a bar on the receiving chart.
Cautionary Note
There is no way to guarantee the order in which two separate intraday charts will update with a new bar, and
thus it is likely that charts updating bars at the same time may not receive the most recent data. As an
example, suppose a 1-minute chart is sending a stream to a 10-minute chart. Six times an hour these charts will
update at the same time, and which updates first is usually a function of the unpredictable timing in which data
is received, or other factors. Therefore at any one of those six times per hour, it is possible that the
10-minute chart will update and ask for streams a second or so before the 1-minute chart updates. The 10-minute
chart will get the streams that are currently available, and will not wait for the 1-minute chart to update.
Therefore it is possible that the 10-minute chart will receive 1-minute-old data from the 1-minute chart. Do
not use these indicators where this could be a problem for you. Generally simultaneous updating is not
as likely when at least one chart is a volume, tick, or range bar chart. To correct this problem, you can
right click on the chart and select recalculate chart to manually update "out of sequence" operations.
Another time that older bars may be sent is when there are no bars to send. This could occur when there are gaps in price bars due to missing data, the exchange not being open, or other causes. When a new value for a bar is available, the bar may change. If you build a prediction or trading rules based on these bars, your trades could change.
Such problems may be less troublesome when sent data is received by the chart with the fastest bars.
InterChart Tools 1 will NOT work on charts that have more than one chartpage.
InterChart Tools 1 indicators include:
Examples
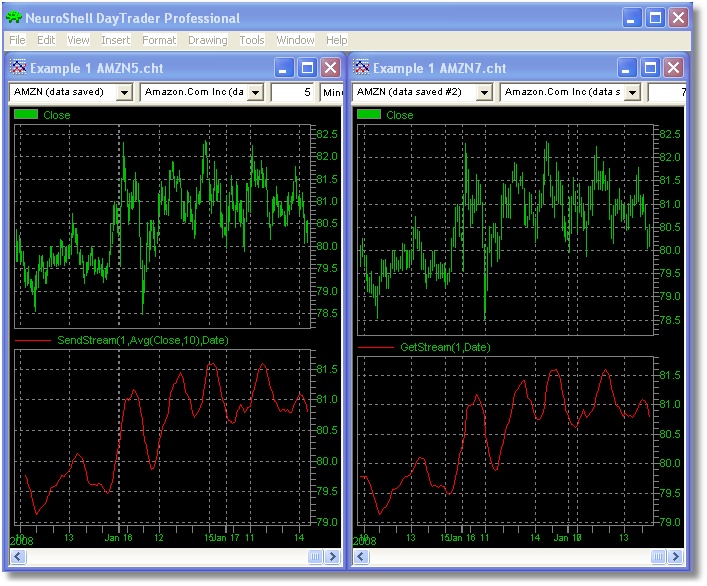
Example 1: This example shows how to send a 10 bar moving average computed on a 5-minute chart to a 7-minute chart.
The 5-minute chart contains the following indicator SendStream that uses a StreamID of 1: SendStream (1,Avg(Close,10))
The 7-minute chart contains the following GetStream indicator, which reads StreamID 1: GetStream(1)
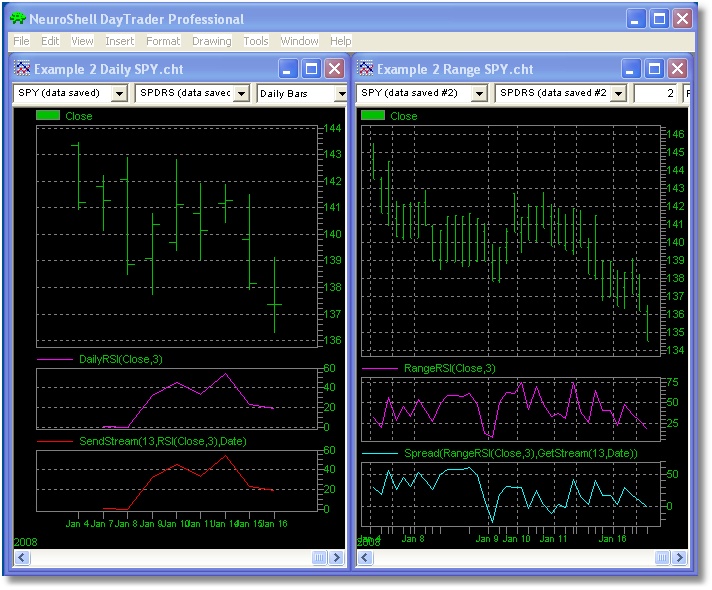
Example 2: In this example a range bar chart computes the spread between an RSI on itself and an RSI from a daily chart.
The daily chart contains an RSI indicator that has been renamed DailyRSI. It also contains the following SendStream Indicator with a user selected StreamID of 13:
SendStream (13,DailyRSI)
The range bar chart contains an RSI that has been renamed RangeRSI. It also contains the following indicator:
Spread(RangeRSI,GetStream(13))
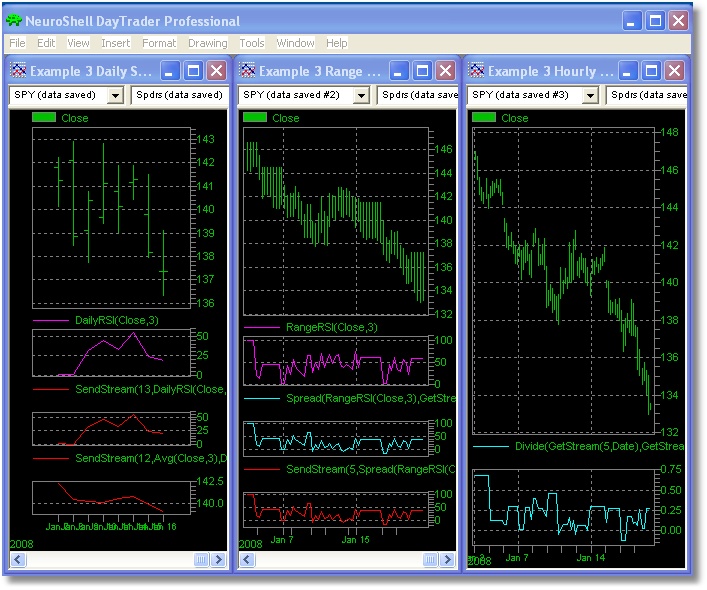
Example 3: The user in Example 2 also creates an hourly bar chart to which he would like to send the spread on his range bar chart. On the hourly chart the user wants to divide the spread by a moving average on one of his/her daily charts.
The following indicator is added to the range bar chart from Example 2, now called Example 3 Range SPY.cht:
SendStream (5,Spread(RangeRSI, GetStream (13)))
The following indicator is added to the daily chart from Example 2, now called Example 3 Daily SPY.cht:
SendStream (12,Avg(Close,10))
Then on the hourly bar chart called Example 3 Hourly SPY, the following indicator is added: Divide(GetSteam (5), GetStream (12))
For more details, please view the product manual for this add-on
The price of the InterChart Tools 1 Add-on is $399. For more information, call Ward Systems Group at 301 662
7950.
BUY NOW
The TimeBars indicators let you to create 5, 10, 15, 30, etc. minute bars on a 1 minute chart in NeuroShell DayTrader, with the added advantage of not having to wait for the higher minute bar to complete before the TimeBar updates. While creating these indicators, Richey Enterprises determined that 90% of the time the high and low for 10 minute bars occur before the end of 10 minute bars. The optimizer in the Trader can determine the bar size which is most appropriate for your desired trading and equity.
The Consolidated Bars indicators can combine the high value from the most recent 5 bars, for example. The Consolidated Bars are especially useful when your trading system is based on tick and range bars. Consolidated bars allow you to de-noise high frequency range and tick bars. The optimizer can identify the optimal number of bars to consolidate during the morning, mid-day and closing sessions to properly de-noise range data without lag and without having to wait for a higher range bar to complete.
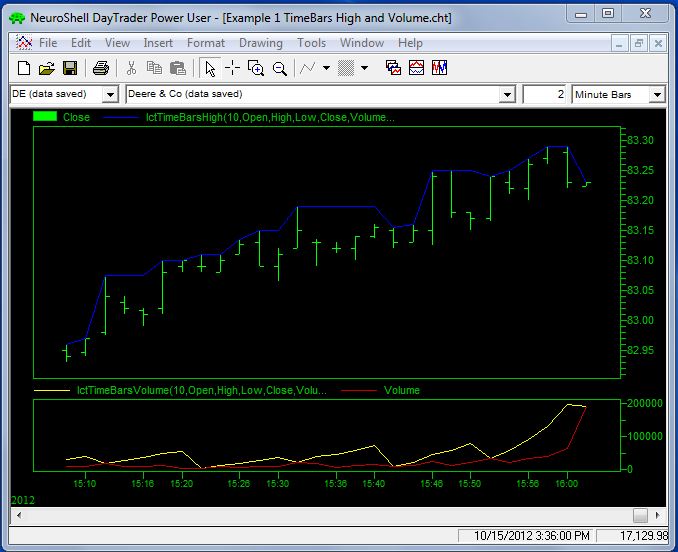
Example 1: Time Bars High and Volume
On the Example 1 chart we have added a TimeBar High indicator. The high bar displays the "highest" high value
from the 10 minute bar since the 10 minute bar began to form. The TimeBar High will continue to build until 10
minutes past the hour at which point it will be identical to the high of a standard 10 minute bar. At 10 minutes
past the hour both indicators will reset and the operation repeats. We also added the TimeBar Volume indicator
to the chart.
When you look at the example chart, the TimeBar high values from the 10 minute bars are almost always correctly defined before the end of the bar time. Therefore any Trading Strategy, Prediction, or indicator which references the high of a higher time frame bar may fire before a standard bar would be able to issue a trade. Similarly, the bar volume builds at the chart frequency. Any Trading Strategy, Prediction, or indicator which depends on a volume level from a higher time frame will fire when that has been achieved. Often this is before half of the bar has been built. Of course, if the volume requirement is not going to be met for this bar, it will not fire falsely.

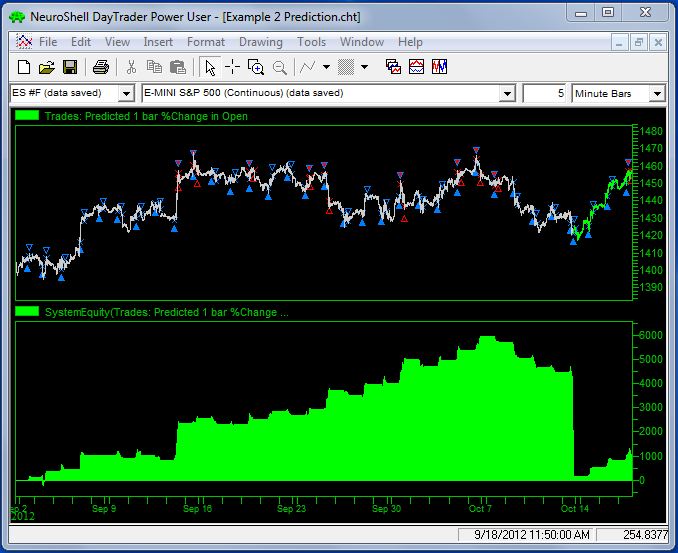
Example 2: Indicators in Predictions
In this example we created a 5 minute chart for the S&P 500 E-Mini which uses several different InterChart
Tools2 indicators based on 10 minute bars (TimeBars HL2, TimeBars HLC3, and TimeBars OHLC4) as inputs to a
prediction of the percent change in open 1 bar in the future from the next open. We did not optimize any input
parameters. The model shows a 15476.1% 1 yr Return on Trades for the out-of-sample period.
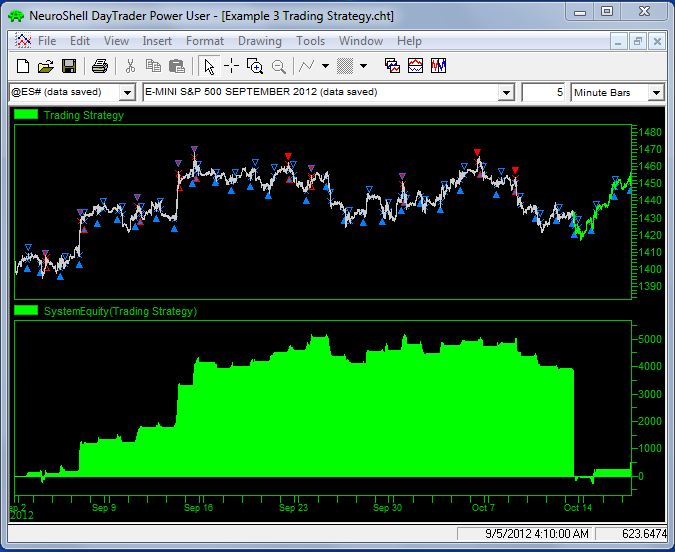
Example 3: Indicators in Trading Strategies
In this example we created a 5 minute chart for the S&P 500 E-Mini which uses InterChart Tools2 high and low
values from a 10 minute bar as the basis for creating an RSI Trading Strategy. We entered a Trading Strategy as
follows:
Long Entry: RSI based on TimeBars Low 10 minute < 30
Optimize the number of periods in the RSI from 1 to 10 and optimize the RSI value from 15 to 45
Short Entry: RSI based on TimeBars High 10 minute > 70
Optimize the periods in the RSI from 1 to 10 and optimize the RSI value from 80 to 90
We set the model to trade 1 between the hours of 8:35 a.m. to 3:30 p.m. We added a margin of $500 and a point value of $50 for the S&P E-Mini. The model returned an annual return on account of 5603.3% in the out-of-sample period compared to a 115.4% annual percent change in price.
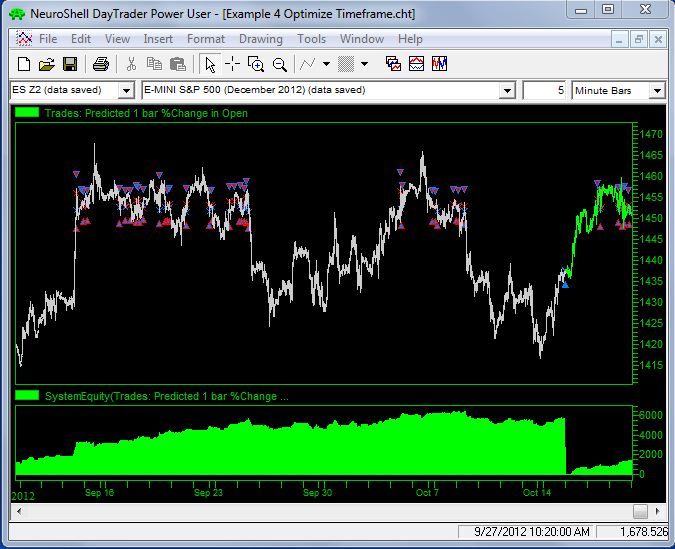
Example 4 Optimize Time Frame
If you don't know which higher time frame to use in your model, you can let the optimizer choose. We created a
prediction much like Example 2, but instead of using different TimeBars indicators based on the same time frame,
we used the same TimeBarsHL2 indicator, one for 10 minute bars and the other for 15 minute bars, both on a 5
minute chart. In the Prediction Parameters settings on the Optimization tab, we limited the maximum number of
inputs to 1 so the optimizer was forced to make a choice of inputs. You could do the same thing with various
numbers of Consolidated Bars. Letting the optimizer choose the best TimeBars or Consolidated Bars could also be
used in the Trading Strategy wizard by choosing Rule Selection Optimization on the Long and Short rules tabs.

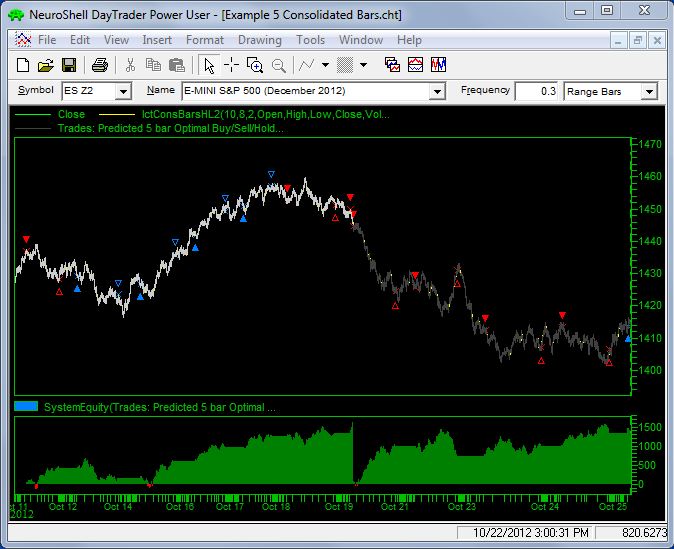
Example 5 Consolidated Bars
We created a .3 range bar chart for the S&P 500 E-Mini, then created a Prediction with both a Consolidated Bars
HL2 indicator and a Linear Weighted Average of the Close as inputs. On tick based charts (range and volume)
these consolidated bars act like variable time bars.
In this example, a 5 bar consolidate of a .3 range bar will display the (H + L) / 2 over the time it took to create the 5 bars. These bars are continuous and always reflect the high of the previous N bars, so as a new bar is added the oldest bar is dropped off. Unlike any moving average which might attempt to do the same, there is never any lag.
The Prediction predicted 5 0.3 range bars into the future from the next open. The model used a $500 margin and a point value of $50. We set the number of hidden neurons down to 1.
The profitable results from the optimization period continued into the out-of-sample period.
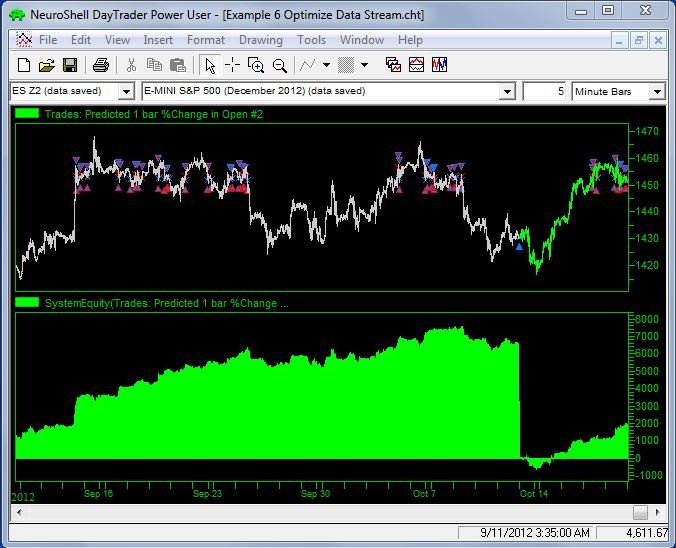
Example 6 Optimize Data Stream
If you don't know which data stream you want to use in your Trading Strategy or Prediction, you can use the
TimeBars indicator and let the optimizer choose a display parameter, which means that the optimizer will choose
the correct data stream.
In this example, we inserted two TimeBars indicators in a prediction and optimized only the display parameter. The two TimeBars were based on 10 and 15 minute bars respectively, and the optimizer chose the 10 minute bar based on the low as the only input for the model.
Consolidated Bars
You can also let the optimizer choose the data stream for Consolidated Bars by optimizing the display parameter
for a Consolidated Bars indicator.
For more details, please view the product manual for this add-on.
The price of InterChart Tools 2 Add-on is $399. For more information, call Ward Systems Group at 301 662 7950.
BUY NOW
Richey Enterprises has developed a set of price indicators called InterChart Tools 21 that generate early trades for NeuroShell Trader. The TimeBars indicators call higher timeframe data to a chart and update every time the base chart updates. There are separate indicators for the open, high, low, close, and volume data as well as several different combinations of that data. The Consolidated Bars indicators combine x number of the most recent bars that you specify into a single data stream and are useful for fast moving tick and range bars.
The TimeBars indicators let you to create 5, 10, 15, 30, etc. minute bars on a 1 minute chart in NeuroShell DayTrader, with the added advantage of not having to wait for the higher minute bar to complete before the TimeBar updates. While creating these indicators, Richey Enterprises determined that 90% of the time the high and low for 10 minute bars occur before the end of 10 minute bars. The optimizer in the Trader can determine the bar size which is most appropriate for your desired rules and equity.
The Consolidated Bars indicators can combine the high value from the most recent 5 bars, for example. The Consolidated Bars are especially useful when your trading system is based on tick and range bars. Consolidated bars allow you to de-noise high frequency range and tick bars. The optimizer can identify the optimal number of bars to consolidate during the morning, mid-day and closing sessions to properly de-noise range data without lag and without having to wait for a higher range bar to complete.
Adaptive Consolidated Bars indicators also combine the information from the most recent bars on a chart, but unlike the regular Consolidated Bars the Adaptive Consolidated Bars treat rising bars and falling bars independently. The Adaptive Consolidated Bars offer the option of consolidating a different number of bars for rising prices as contrasted to the number of bars for falling prices. Since the function of a consolidated bar is to absorb noise and rising price jitter is often different from falling price jitter, the Adaptive Consolidated Bars permit an asymmetrical definition to accommodate this.

Example 1: Time Bars High and Volume
On the Example 1 chart we have added a TimeBar High indicator. The high bar displays the "highest" high value from the 10 minute bar since the 10 minute bar began to form. The TimeBar High will continue to build until 10 minutes past the hour at which point it will be identical to the high of a standard 10 minute bar. At 10 minutes past the hour both indicators will reset and the operation repeats. We also added the TimeBar Volume indicator to the chart.
When you look at the example chart, the TimeBar high values from the 10 minute bars are almost always correctly defined before the end of the bar time. Therefore any Trading Strategy, Prediction, or indicator which references the high of a higher time frame bar may fire before a standard bar would be able to issue a trade. Similarly, the bar volume builds at the chart frequency. Any Trading Strategy, Prediction, or indicator which depends on a volume level from a higher time frame will fire when that has been achieved. Often this is before half of the bar has been built. Of course, if the volume requirement is not going to be met for this bar, it will not fire falsely.
Example 2: Indicators in Predictions
In this example we created a 5 minute chart for the S&P 500 E-Mini which uses several different InterChart Tools2 indicators based on 10 minute bars (TimeBars HL2, TimeBars HLC3, and TimeBars OHLC4) as inputs to a prediction of the percent change in open 1 bar in the future from the next open. We did not optimize any input parameters. The model shows a 15476.1% 1 yr Return on Trades for the out-of-sample period.

Example 3: Indicators in Trading Strategies
In this example we created a 5 minute chart for the S&P 500 E-Mini which uses InterChart Tools2 high and low values from a 10 minute bar as the basis for creating an RSI Trading Strategy. We entered a Trading Strategy as follows:
Long Entry: RSI based on TimeBars Low 10 minute < 30
Optimize the number of periods in the RSI from 1 to 10 and optimize the RSI value from 15 to 45
Short Entry: RSI based on TimeBars High 10 minute > 70
Optimize the periods in the RSI from 1 to 10 and optimize the RSI value from 80 to 90
We set the model to trade 1 between the hours of 8:35 a.m. to 3:30 p.m. We added a margin of $500 and a point value of $50 for the S&P E-Mini. The model returned an annual return on account of 5603.3% in the out-of-sample period compared to a 115.4% annual percent change in price.

Example 4 Optimize Time Frame
If you don't know which higher time frame to use in your model, you can let the optimizer choose. We created a prediction much like Example 2, but instead of using different TimeBars indicators based on the same time frame, we used the same TimeBarsHL2 indicator, one for 10 minute bars and the other for 15 minute bars, both on a 5 minute chart. In the Prediction Parameters settings on the Optimization tab, we limited the maximum number of inputs to 1 so the optimizer was forced to make a choice of inputs. You could do the same thing with various numbers of Consolidated Bars. Letting the optimizer choose the best TimeBars or Consolidated Bars could also be used in the Trading Strategy wizard by choosing Rule Selection Optimization on the Long and Short rules tabs.
Example 5 Consolidated Bars
We created a .3 range bar chart for the S&P 500 E-Mini, then created a Prediction with both a Consolidated Bars HL2 indicator and a Linear Weighted Average of the Close as inputs. On tick based charts (range and volume) these consolidated bars act like variable time bars.
In this example, a 5 bar consolidate of a .3 range bar will display the (H + L) / 2 over the time it took to create the 5 bars. These bars are continuous and always reflect the high of the previous N bars, so as a new bar is added the oldest bar is dropped off. Unlike any moving average which might attempt to do the same, there is never any lag.
The Prediction predicted 5 0.3 range bars into the future from the next open. The model used a $500 margin and a point value of $50. We set the number of hidden neurons down to 1.
The profitable results from the optimization period continued into the out-of-sample period.

Example 6 Optimize Data Stream
If you don't know which data stream you want to use in your Trading Strategy or Prediction, you can use the TimeBars indicator and let the optimizer choose a display parameter, which means that the optimizer will choose the correct data stream.
In this example, we inserted two TimeBars indicators in a prediction and optimized only the display parameter. The two TimeBars were based on 10 and 15 minute bars respectively, and the optimizer chose the 10 minute bar based on the low as the only input for the model.
Consolidated Bars
You can also let the optimizer choose the data stream for Consolidated Bars by optimizing the display parameter for a Consolidated Bars indicator.
Example 7 Consolidated Bars vs Adaptive Consolidated Bars
The Adaptive Consolidated Bars were able to increase the profits from the original Trading Strategy built on crossovers of Exponential Moving Averages of consolidated bars.
For more details, please view the product manual for this add-on.
The price of InterChart Tools 21 Add-on is $499. For more information, call Ward Systems Group at 301 662 7950.
BUY NOW

The basis of the indicators is extractions of dynamics of price and time with the added mathematical calculations that attempt to capture the pure impulse movement of the instrument being evaluated. It is also understood that the indicator’s reliability and quality of feedback is based on the issue having adequate volume movement to ascertain the impulse of the indicator with higher efficiency and correlation. As with all technical analysis indicators, iCinDER™ cyclical indicators are designed to be used with other indicators you may be familiar with and that the user verify correlation to achieve positive confirmation of the output that is provided by iCinDER™ indicator.
The W3 and V2 indicators can also be filtered by other indicators such as RSI, Linear Regression Slope as well as others that the user may want to experiment with in their models.
How all this came to be…
Interview with Raul Jimenez, creator of iCinDER W3 and V2.
I have been trading since about 1989 and have devoted time to studying trading, indicators, Dow Theory, Elliott Wave Theory, etc. During all my trading years, I found rules that worked for a while then stopped working. At the time, I did not understand why but changed to another system that would work for a while.
In 2006, after working for a large software company for a number of years, I decided it was time to stop the traveling and fast paced lifestyle and devote some time to something I was passionate about – trading in the stock market.
I had spent time reading books on cycle analysis, MACD, RSI, adaptive indicators and other methodologies. It all came back to me as either the cycles were too closely correlated, tight fitting with virtually no divergence or loosely coupled. I knew that mathematically it was possible to measure multiple timeframes and correlate them to a single wavelength, which while not adaptive could provide high correlation to the measured instruments. I will not bother with discussing all the experiments, but one thing was clear – the business cycle was part of the solution. With this in mind, I devised an indicator that analyzed price and time in 5 dimensions – this became V2 – and a secondary indicator that added a theoretical momentum type dimension. This last part was composed of 2 dimensions at 2 timeframes. Adding all this together to V2 --- W3 was born. This was December of 2006 when this was completed.
Initial complex implementations with scanners and strategies were done for Tradestation, and to date that is the most complete and complex model I have developed. The simple V2 and W3 were ported to other platforms – Metastock, eSignal and others.
Now we fast track to 2009 when a good friend of mine, George D, started discussing GA with me. I had worked on this before and thought of having a fresh look at V2 and W3 within a GA. My friend recommended Neuroshell. The rest is now history – about 5 months of work and testing, building models with iCinDER™ indicators and adding TurboProp, Fuzzy Indicators, Neural Indicators and Chaos Hunter.
Today, we have both V2 and W3, implemented in an external DLL. We ship the indicators with an extensive
Help File and sample models that the user can use as starting points for their own models. We plan on
providing more complex models for the users that have TurboProp, NI and even Chaos Hunter.
BUY NOW
The way a human would typically do pattern matching on financial data is as follows: He or she would scan the price stream (close) looking for distinct movements. Then he or she would examine the pattern formed by the changes in close for some number of bars (let's say 11) just prior to the distinct movements. If this human is pretty good at pattern recognition, he or she might even examine the changes in the open, high, and low of the preceding 11 bars as well as the change in close in those bars. The human is looking for what types of patterns in the prior 11 bars that foretell the distinct movement.
Once the human is satisfied that there is a high probability of the distinct movement following certain patterns, he or she can then watch for those patterns in the future. When the patterns appear, the human expects one of the distinct movements to follow and places orders appropriately.
The example above is the inspiration behind the enhancements to Adaptive Net Indicators (ANI) release 2.0. ANI always did pattern matching, but now in release 2.0 new functions not only include the current bar in the inputs but a number of lags of the input as well.
Adaptive Net Indicators are special versions of GRNN and PNN neural nets formulated to do pattern matching, both predicting and classifying. They retrain (quickly) on every new bar, so they are never more than 1 bar behind. You can set the contribution factors yourself so that the net uses your specification of how important the inputs are, instead of the other way around. Of course, you could also let the genetic optimizer find them if you own the NeuroShell Trader Professional or the DayTrader Professional. As a matter of fact, you can also let the GA find the optimal number of bars ahead to predict and the optimal training set size!! If that's not enough exclamation points, how about this: you can even let the GA find the best thing to predict by optimizing the parameters (including whether open, high, low, or close) of your output indicator!!! Adaptive Net Indicators is a package with unprecedented flexibility and capabilities!!!!
Many of you have expressed a desire to have confidence factors for your nets. The classification series of Adaptive Net Indicators will provide you with confidence. In addition, Adaptive Net Indicators will make no prediction at all if they feel they have no basis on which to do so.
Our Adaptive Net Indicators do pattern matching by comparing each new pattern encountered with a number of immediately previous known patterns. They do not use weights like most neural nets. The Net "output" (i.e., the output of the indicator) is derived from the outputs of the immediately previous patterns. It is most heavily influenced by the most closely matching of the known patterns, and so the output of any new pattern encountered will be much like similar known patterns. You the user can set the number of immediately previous patterns which the Net compares to the new pattern.
The Net indicator has "inputs" in which the pattern is stored, just like other indicators and neural nets. If a Net has 3 inputs, you can feed in the current values of the RSI, a CCI, and the Momentum to form the pattern, for example. Or you could feed the Net today's close, yesterday's close (lag 1 of close), and the close the day before (lag 2 of close). You can feed Net outputs into a Net, just as you could do with any other indicator. With some of our indicators, you can also input many "lags" of the primary inputs as well.
Nets also have another type of input, called the "Actual" value. This is where you show the Net what you want the outputs to be like. In other words, you "train" the Nets to produce values like the Actual value whenever the corresponding inputs are closely matched. You want the Net to predict for you the Actual value X bars in advance. The output of the Net is the prediction of the Actual value X bars ahead. You get to pick what X is for each Net. This is just like our neural nets in the NeuroShell Trader. Furthermore, you can even optimize the value of X in a Trading Strategy.
There is another big difference between our Adaptive Nets and the neural nets in the NeuroShell Trader. The contribution factors for each input are also inputs. That's right, instead of the net telling you the contribution of each input variable, you get to tell the Net what the contribution should be. The higher the contribution, the more heavily the Net will weigh that input when it does pattern matching. Of course, if you'd rather have the contribution factors figured out for you, the NeuroShell Trader Professional can optimize them.
There are two kinds of Adaptive Nets, depending on the type of output they produce. There are "Prediction Nets" whose outputs are predicted values (like price change, percent change in price, predicted indicator values, etc.). There are also "Classifier Nets" whose output is a probability of the pattern being of one type or another. Types might be "Buy" and "Hold", for example. Other types can be "Good" and "Bad", or "Up" and "Down", etc.
The Classifier Nets don't actually read or produce the strings like "Buy" and "Hold". You use positive numbers in the Actual for one category like "Buy", and zero or negative numbers for the other category like "Sell". The predicted output will be a number between -1 (strong probability of sell) and 1 (strong probability of buy). Numbers close to zero could be considered "Hold" (YOU would decide how close to zero a prediction should be to be considered a "Hold")
One of the interesting things you can do with Adaptive Net Indicators is build adaptive moving averages. You can adjust how tight or how loose the adaptive moving average is. The chart below shows an adaptive net indicator configured as an adaptive moving average.
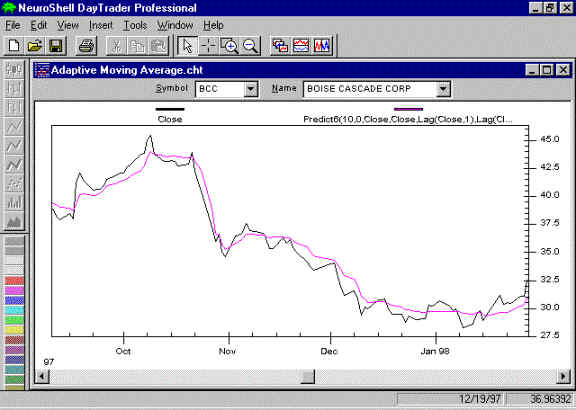
There are a total of 18 Adaptive Nets, nine Predictor Nets and nine Classifier Nets. There are 9 of each because each of the nine takes a different number of inputs as follows:
For more details, please view the product manual for this add-on.
BUY NOWMany of our customers have asked for a version of our famous TurboProp2 that retrains itself as often as every bar. Well here it is, formulated as an indicator! Just insert it into your chart or trading strategy just like any other indicator. Never has a neural net been easier to use, yet so powerful!
Adaptive TurboProp2 (AT2) is the same basic neural network that is used in the NeuroShell Trader, Trader Professional, and NeuroShell DayTrader Professional Prediction Wizard. However, AT2 can retrain itself as frequently as every new bar or after a number of bars which you can specify. The training set is always the most recent bars. AT2 does not make predictions on the training set bars, and its predictions are always "out of sample" (exception: when you specify that you are predicting zero bars ahead). Therefore, there are no walk forward periods to worry about, since the net is essentially walking forward each day (or each bar in the case of the NeuroShell DayTrader Pro).
An AT2 net may be used as an indicator, as an input to a regular TurboProp2 net in the Prediction Wizard, or it may be used directly in a Trading Strategy. The output is a indicator, meaning that the prediction is shown on the current bar, even if it is a prediction for 10 bars from now.
AT2 doesn't require the optimizer in the Professional versions of the Trader because the parameters are so easy to set. However, when used with the NeuroShell Trader Professional or NeuroShell DayTrader Professional, you can optimize the following parameters:
AT2 nets allow 2 to 14 inputs. The names of the indicators are correspondingly Tprop2, Tprop3, …, Tprop14.
Adaptive TurboProp2 requires release 3.2 or better of the NeuroShell Trader, NeuroShell Trader Professional, or NeuroShell DayTrader Professional.
For more details, please view the product manual for this add-on.
BUY NOWThe NeuroShell Trader® Professional has around 800 technical indicators. However, that didn't stop our users from wanting more! They sent us requests for more indicators, some of which were simple to build, and some of which required a great deal of research. So we built another add-on called the Advanced Indicator Set 1 with these requested indicators.
These are not part of the NeuroShell Trader®, NeuroShell Trader® Professional, or NeuroShell® DayTrader Professional, but you can buy them as an optional add-on if you want them. They require release 3.0 or above of the NeuroShell Trader®, NeuroShell Trader® Professional, or NeuroShell® DayTrader Professional.
Click here for a brief overview of the indicators in Advanced Indicator Set 1, which are all listed below:
TECHNICAL INDICATORS
CHAOS AND FRACTAL INDICATORS
STATISTICAL INDICATORS
ASTRONOMICAL INDICATORS
DATE INDICATORS
MATH INDICATORS
For more details, please view the product manual for this add-on.
BUY NOWThe NeuroShell Trader® Professional has around 800 technical indicators. However, that didn't stop our users from wanting more! They sent us requests for more indicators, some of which were simple to build, and some of which required a great deal of research. So we built another add-on called the Advanced Indicator Set 1 with these requested indicators.
These are not part of the NeuroShell Trader®, NeuroShell Trader® Professional, or NeuroShell® DayTrader Professional, but you can buy them as an optional add-on if you want them. They require release 3.0 or above of the NeuroShell Trader®, NeuroShell Trader® Professional, or NeuroShell® DayTrader Professional.
Click here for a brief overview of the indicators in Advanced Indicator Set 2, which are all listed below:
J. Welles Wilder’s Indicators
Redundant Haar Wavelets
Miscellaneous Indicators
Marc Chaikin’s Indicators
Flag Indicators
Bar/Condition Count Indicators
For more details, please view the product manual for this add-on.
BUY NOWAdvanced Indicator Set 3 is an eclectic set of indicators that expand NeuroShell Trader's ability to find a value between two separate conditions or since the occurrence of a single condition. The Find and Count indicators are designed to answer traders’ questions about data such as what is the max value of the close in the time between a Bollinger Band High Breakout and a Bollinger Band Low Breakout or count the number of times the percent change in close was greater than x percent from February 1 to May 31.
In addition, Set 3 adds the power to remember or toggle values off and on based on conditions. The Remember and Toggle indicators may be used to create complex Predictions and Trading Strategies. These functions complement the NeuroShell Trader's emphasis on building indicators with a wizard rather than requiring the user to be a programmer. The result is a significant speed increase in building and testing trading rules.
Advanced Indicator Set 3 also includes indicators specifically designed for pair trading. The PairEntry and PairExit set lets you build traditional market neutral rules that simultaneously buy and sell a pair of instruments that follow one another and frequently cross prices. When those pairs are hard to find, the ProxyEntry and ProxyExit indicators expand possibilities for pair trading by using the NeuroShell Trader’s neural nets to create cointegrated pairs.
Rounding out this diverse mix are two indicators that compute the correct sun time and distance to the moon.
The following descriptions of the Advanced Indicator Set 3 indicators are abbreviated. There are more comprehensive descriptions in the help file.
The task oriented indicators in Set 3 such as Find, Count, Remember, and Toggle require the use of conditional indicators. The NeuroShell Trader includes many conditional indicators such as rules, Boolean, relational, crossovers, candlesticks, etc. Advanced Indicator Set 3 expands those choices with the following indicators:
FollowedBy - returns a 1 for true when a Condition1 is followed by a Condition2. Other times it returns a zero.
TimeIs - specifies a time as a condition for another indicator.
DateIs - specifies a date as a condition.
Peak - specifies the highest value within a certain number of bars.
Valley - looks for the lowest value within a certain number of bars.
BarNumber - returns a 1 when the specified bar number appears in a chart. The first bar in the chart is numbered 1, the second bar is numbered 2, etc.
Find - calculates values such as count, point change, percent point change, max, min, sum, average, standard deviation, variance, median, regression slope, number of advancing bars, number of declining bars, max advance, and max decline based on two conditions occurring in a data stream.
FindInclusive – does the same as the Find indicator but includes the bars on which the conditions are true.
FindSince and FindSinceInclusive - find similar values from the time Condition1 occurs until the end of the chart.
Count - calculates a running total of the number of times a specified condition occurs in between a start condition and an end condition.
CountInclusive – same as the Count indicator but includes the bars on which the conditions are true.
CountSince and CountSinceInclusive - these indicators begin their running total with the occurrence of Condition1, but Condition2 is replaced by the current bar.
Remember - outputs a time series value based on a condition you specify. For example, the Remember indicator would output the value of the high (the time series) when the 9 period moving average crosses above the 13 period moving average (the condition). The output value would remain the same until the condition is met once again, at which time the current high would become the output.
Remember2, Remember3, and Remember4 - output a different value depending upon which of several conditions is activated. The Remember indicators may be used as variable inputs to other indicators, Predictions or Trading Strategies. The conditions are true/false indicators or any indicator that produces a value of either 0 or a non-zero value.
Toggle - signifies the presence or absence of conditions you specify. The Toggle indicators may also be used to remove certain data when training a neural net, e.g., only train a net on bars between 1 p.m. and 4 p.m. The Toggle indicators output 0, 1, or a missing value based on the settings for the What parameter.
ToggleInclusive – same as Toggle but includes but includes the bars on which the conditions are true.
ToggleSince and ToggleSinceInclusive - these indicators begin their running total with the occurrence of Condition1, but Condition2 is replaced by the current bar.
PairEntry - compares the value of the close, which is different for each of the two chart pages, to the value of Price1 (the first stock) and Price2 (the second stock) and determines which stock goes long and which stock goes short. The values of Price1 and Price2 are also used to compute the spread between stocks in order to determine an entry point for the trade.
PairExit - determines the exit conditions for trades entered with the PairEntry indicator. The PairExit indicator includes the StopSpread parameter that can be set as an emergency exit for both stocks.
ProxyEntry – similar to PairEntry but uses a neural net prediction to create proxy pairs by using one stock to predict the price of another. Uses the spread between the actual and predicted prices to pair trade the predicted stock and the one used as an input to the net.
ProxyExit - determines the exit conditions for trades entered with the ProxyEntry indicator. The ProxyExit indicator includes the StopSpread parameter that can be set as an emergency exit for both stocks.
EquationofTime - returns the difference between solar time (as measured by a sundial) and mean clock time.
MoonDistance - outputs the distance between the center of the Earth and the center of the Moon expressed in kilometers.
For more details, please view the product manual for this add-on.
BUY NOWThe Cluster Indicators, like some of the other add-ons from Ward Systems Group, are based on how the human brain might classify the market. However, this NeuroShell Trader® add-on isn't even a neural network (although neural net enthusiasts will see this as a Kohonen Self Organizing Map, trained by genetic optimization!)
Think about this. Suppose you have two good inputs. Now suppose you made a scatter plot of a bunch of recent bars
worth of these inputs. (For the math minded, all recent bars are plotted with one input on the Y axis and the
other on the X axis.) Now suppose the inputs are good, as defined by the fact that their patterns foretell an
uptrend or a downtrend in the price. Then wouldn't the bars that precede an uptrend look somewhat similar, at
least after they were "normalized"? Wouldn't those that precede a downtrend look similar too? In other words,
wouldn't the buy bars cluster together and the sell bars cluster together?
The graph displays long entry and short entry clusters for a Cluster Indicator based on the MACD and CCI indicators as inputs.
Our new Cluster Indicators tell you how far the current bar is from the cluster center of the recent "buy" bars or "sell" bars. You can use a Cluster indicator as a buy rule, buying when the current bar is "close" to the cluster center of recent "buy" bars. Sell when the current bar is "close" to the "sell" cluster center.
The genetic optimizer in the Trader Pro or DayTrader Pro finds the cluster centers that optimize the profit.
The Cluster indicators also make dynamite inputs to a neural network. (For the neural net enthusiasts, this creates a paradigm much like the popular classic Radial Basis Function neural nets, except in the Trader Pro, your clusters don't have to all be based on the same inputs, and in fact can be optimized! There was also a paradigm called Counter-propagation that was similar to feeding our Cluster indicators into a neural net.)
Now expand the concept to as many as 16 inputs. Those can't be plotted because you'd need a 16 dimensional scatter plot. But you can still measure how close the current bar is to a 16 dimensional cluster center! There are 16 Cluster Indicators.
Let's carry the concept a little further. Suppose some of the inputs are less effective than others in determining whether there is a buy or sell situation. You wouldn't want to consider these inputs as much when determining clusters and "closeness". No problem, we have 8 Cluster "contribution" indicators, each of which has contribution factors which reduce or increase the impact of an indicator. You can set these contribution factors yourself or you can let the genetic optimizer do it for you. Either way, you now have a more powerful clustering indicator.
Cluster Indicators require release 3.2 or better of the NeuroShell Trader Professional or NeuroShell DayTrader Professional.
For more details, please view the product manual for this add-on.
BUY NOWHow many times have you wished you could just let your software scan a price series and let you know when it has found a particular pattern that you like? You have in your mind a special pattern of moves that you believe could precede a strong change in the market, but you'd like the software to just monitor the incoming bars looking for your pattern. Well now you can do just that with the Fuzzy Pattern Recognizer add-on for the NeuroShell Trader series! And you can do it using fuzzy logic!
Fuzzy logic was invented by Lofti Zadeh, and written about extensively in books by Bart Kosko. Fuzzy logic has been used successfully in machines and software around the world, even in "smart" household appliances. Now you can add this smart control to your trading, and it is easy to use because we've done the hard work for you!
The Fuzzy Pattern Recognizer is a fuzzy logic engine which lets you describe your pattern in "fuzzy" rules (approximate rules of thumb). It is really a series of indicators that show you, on a scale of 0 to 1, how closely the current price series matches your pattern. Turn on an alert in the DayTrader Professional and the Fuzzy Pattern Recognizer will scan your incoming bars looking for all of your favorite patterns. The alert will sound when the match is above .6, .8, or any value you select.
Fuzzy rules are rules that are general in nature, not exactly specified. We describe price or indicator curves with the following fuzzy (verb) rules:
Here are some example rules written in English which can be specified in the Fuzzy Pattern Recognizer add-on:
Here are some additional highlights of the Fuzzy Pattern Recognizer:
There are 8 "fuzzy (verb) rule" indicators in the add-on, Fuzzy1, Fuzzy2, ... , Fuzzy8. Fuzzy1 handles "1 segment" rules such as "close rises" or "open drops sharply". Fuzzy2 handles "2 segment" rules such as "close rises, then drops sharply". Fuzzy3 is for "3 segment" rules such as "open rises, then drops, then remains steady", etc.
Example of the Fuzzy2 indicator output (bar chart at the bottom).
The search rule is "Close rises, then
drops", Segment Size=8 bars, and Max Change=7.
There are 3 FuzzyOR rules and 3 FuzzyAND rules: FuzzyOR2, FuzzyOR3, FuzzyOR4, FuzzyAND2, FuzzyAND3, FuzzyAND4. As previously mentioned, these combine rules. For example, suppose you are looking for either a pattern that rises sharply then drops sharply, or a pattern that rises sharply, then remains steady, and then drops sharply. Then you would use a FuzzyOR2 indicator which takes as arguments a Fuzzy2 indicator and a Fuzzy3 indicator, each specifying their respective rules.
FuzzyOR and FuzzyAND indicators may take other FuzzyOR and FuzzyAND indicators as arguments, as long as the lowest level indicators are "rule" indicators such as Fuzzy2.
There are also 8 FuzzyGA indicators, which allow the genetic optimizer to tune the fuzzy logic engine better.
We believe that Fuzzy Pattern Recognizer indicators open a whole new world of possibilities in trading with artificial intelligence. We think it will be our most popular add-on yet!
The Fuzzy Pattern Recognizer add-on requires release 3.2 or better of the NeuroShell Trader, NeuroShell Trader Professional, or NeuroShell DayTrader Professional. If you do not own one of the Pro versions, you can still use the Fuzzy Pattern Recognizer add-on to find patterns, but you will not be able to optimize the Fuzzy indicators.
For more details, please view the product manual for this add-on.
BUY NOWYou've asked for it, and now it is here: the Fuzzy Sets add-on for NeuroShell Trader Professional and DayTrader Professional.
Fuzzy logic was invented by L.A. Zadeh and further popularized by Bart Kosko. Fuzzy logic is not some theoretical idea that has yet to catch on. By 1990 the Japanese had over 100 real fuzzy control applications and products. The city of Sendai in Japan has controlled its subway with fuzzy logic since 1988. General Motors’ highly successful Saturn applies fuzzy logic for automatic transmission shift control. Duke University engineers have shown that intentionally imprecise rules of thinking can help hotel computers sell the right room to the right customer at the right time, thus boosting income.
Ward Systems Group introduced what we believe was the first commercial trading software to allow users to describe price movements with fuzzy logic statements (the Fuzzy Pattern Recognizer add-on). A user could essentially give NeuroShell instructions such as:
"Find patterns where the price rose, then dropped, then dropped sharply, then rose sharply."
The new Fuzzy Sets add-on is somewhat different in that it allows users to describe a combination of values of traditional indicators with fuzzy logic. With Fuzzy Sets the user can instruct NeuroShell with functions equivalent to fuzzy statements like:
"Buy when the Stochastic %K indicator is very high, and the Commodity Channel Index is high, and the spread between two moving averages is low."
Contrast that with the typical trading utilization of an indicator is to make decisions based upon rules like whether that indicator (let’s say the Stochastic %K) is above or below some threshold. For example:
Buy when the STOCH%K > 70 and sell when the STOCH%K < 40
Those 2 rules above are sometimes called "crisp" rules, because they "break off" suddenly. In the last rule above, you are buying when the STOCH%K is 70 but not when it is 69. A human might still give consideration to buying when the STOCH%K reached 69, or even at a level of 65, although he would not consider it as strong as a buy as when STOCH%K = 70. In fact, a human would probably consider STOCH%K=80 to be a much stronger buy sign than STOCH%K=70.
Fuzzy rules are a little different than crisp rules in that they do not break off suddenly. Let's consider the following example, where we will use the STOCH%K again. Suppose we have decided that STOCH%K can be considered to be in one of 5 categories or "fuzzy sets":
Then we could create "fuzzy" rules such as one of these two:
Buy when STOCH%K is high and sell when STOCH%K is very low. Buy when STOCH%K is very high and sell when STOCH%K is medium.
Actually the Fuzzy Sets add-on does not really use fuzzy words like low, very high, etc. For one thing, instead of just 5 fuzzy sets (very low, low, medium, high, and very high) you can have 10 or 20 or even more if you like. So instead of words, we use 1 for the lowest, 2 for the next lowest, etc. on up to the highest range.
Of course, most people will have no idea what fuzzy set you should be looking for in order to buy or sell, so that's where the NeuroShell optimizer comes in. The optimizer will decide the total number of fuzzy sets, and which set you should have for a long entry, long exit, short entry, and short exit.
Our Fuzzy Sets indicators can be used in Trading Strategies as well as neural nets. We have some that do a Fuzzy-AND of up to 10 fuzzy indicators, and other that do a Fuzzy-OR of up to 10 fuzzy indicators.
For more details, please view the product manual for this add-on.
BUY NOWNeural Indicators (NI) are several types of neural networks packaged as technical indicators. They will probably appeal to those who like to experiment with neural nets, because there are several types, all with different features. They are based somewhat on the "backpropagation" nets that we feature in our NeuroShell 2 classic network package, but there are two major differences. First, they are not trained with the old backprop neural network. Second, they are not trained to predict anything, only to produce accurate buy and sells. Here are the salient features:
NI provide outputs from -1 to 1. The general interpretation of these outputs will be some sort of "binary" classification, like "buy" (>0) or "don't buy" (< or = 0). Usually, we simply insert them in a trading strategy as a rule (condition) to buy and sell.
NI give probabilities of the outputs they produce, because if they are providing a sell, for example, the closer to 1 the output is, the stronger the probability of sell. The closer to -1, the stronger the probability of "don't' sell".
NI are "unsupervised" neural networks, meaning that they do not need to be trained by showing them the correct answers, like most neural networks (i.e., "supervised" neural networks). You do not teach them by providing any kind of actual output which they learn to reproduce, as with most neural nets.
NI "learn" how to give their outputs based upon evolutionary pressure. The genetic optimizer in the NeuroShell Trader Professional or NeuroShell DayTrader Professional "evolves" NI that give better and better outputs. Survival of the fittest controls the evolutionary process as usual, where fitness is determined by how much money the NI make, or how good they work as inputs to other nets or indicators.
Although anyone can use NI, neural network aficionados will love them because there are several highly technical neural network "architectures" from which you can choose.
Warning: You do not have to understand how these architectures work in order to build profitable trading rules. You can insert Neural Indicators into your trading rules and let the optimizer find the appropriate settings. Neural Indicators are highly technical from a neural network standpoint, and although they can be used by novices, they can only be fully understood internally by those who have a background in how neural networks function.
Ward Nets. This architecture has two different "activation functions" in the hidden neurons. These are called "Ward Nets" since Ward Systems Group invented them many years ago (they first appeared in our classic product NeuroShell 2). The genetic optimizer will find out how to pick the activation functions for you. Ward Nets include Ward2, Ward3, Ward4, Ward5, and Ward6, depending upon the number of inputs.
Jump Connections. This architecture has connections directly from inputs to outputs as well as the usual hidden neuron connections. This architecture also features connections from one hidden neuron to the next, like Turboprop 2 has. Jump Nets include Jump2, Jump3, Jump4, Jump5, and Jump6, depending upon the number of inputs.
Recurrent Nets. This architecture analyzes not only the current bar of information to produce its output, but it also reviews a condensed summary of the most recent bars as well. More recent bars receive more weighting than older ones. Recurrent Nets include Recur2, Recur3, Recur4, Recur5, and Recur6.
Sparse Nets. These are nets which are not fully connected between the input and hidden neural layers. This means that more inputs can be fed to them without increasing the number of weights drastically. The fact that less information can be stored in sparse weighting connections is compensated for by the fact that less weights allow better optimization. Sparse Nets include Sparse8, Sparse10, and Sparse12.
We have implemented modified versions of all of the above nets. The conditional version of each of these architectures produces a value of either true or false rather than a value between -1 and 1. Therefore the conditional version of any of the architectures can be used in a Trading Strategy without the necessity of inserting it into an A>B indicator.
These nets generalize very well, meaning they do not have a strong tendency to "overfit" or "curvefit" like backpropagation neural nets do.
Neural Indicators require the NeuroShell Trader Professional or NeuroShell DayTrader Professional, release 3.2 or better.
For more details, please view the product manual for this add-on.
BUY NOWThe Pattern Matcher add-on grew out of many requests by users who wanted to know if patterns in their data streams had occurred before in history, and if so, what type of activity followed those historical patterns. Some users also wanted to identify a pattern in history and be alerted when a similar pattern occurs in the future. The Pattern Matcher add-on meets both needs by providing indicators that match patterns and revealing the subsequent activity.
Pattern Matcher indicators work on any data stream in the NeuroShell Trader, Trader Professional, or DayTrader Professional. The Pattern Matcher can find patterns in raw price data streams or indicators made from raw data streams. It is often advantageous to match patterns in indicators applied to prices rather than to the prices themselves, as you will see in a subsequent section of this document.
The Pattern Matcher is unlike any of our other add-ons in that it is not designed for use in either a neural network or a trading strategy to make buy/sell decisions. It is intended that the user treat the Pattern Matcher as an intellectual tool to provide input to one's own biological neural networks for discretionary trading, or as confirmation of other indications you may be obtaining in other ways.
So what does this mean? It means that the Pattern Matcher is designed to provide answers to the questions that have plagued technical analysts since long before computers were born:
You will be making your own subjective decisions about whether or how to trade based on the information the Pattern Matcher is showing you. These subjective judgments will be based on your own study and experience watching similar patterns, and based upon your decisions about what data streams in which to watch for patterns. Price streams (like open, high, low, close, and volume) may not be the proper data streams to be monitoring for patterns. Indicator data streams, in our experience, seem to provide a more reproducible pattern source.
At Ward Systems, we have used the Pattern Matcher in the way just described. We have found that there is less value in trying to feed Pattern Matcher input into either neural nets or rules. We believe the tool is a powerful resource which will help you even the playing field, so to speak, as you compete with professional traders who have years of experience recognizing and reacting to patterns in the markets. They rely on their memories and intuition - you now have an analytic tool to bring to odds of success more in your favor.
Furthermore, you should not assume that past patterns are an indicator of future performance. The pattern matcher may very well be a powerful tool for the contrarian trader too. The markets are quite capable of reversing what usually happens after recurring patterns. If this were not true, it would be easy to predict and make money in the markets, and we all know that it isn't easy.
The following descriptions of Pattern Matcher Indicators are abbreviated. There are more comprehensive descriptions in the help file.
Match - The Match indicator takes a very recent pattern on the chart and displays the probability that other patterns in history on the chart match that current pattern.
MatchPast - The MatchPast indicator takes a designated pattern on the chart and displays the probability that other patterns in both history and future on the chart match that designated pattern.
ProjectAvg - The Project Average indicator returns the average of all projections (leads) of the projection series for all pattern matches that are greater than the indicated projection threshold.
ProjectMin - The Project Average indicator returns the minimum of all projections (leads) of the projection series for all pattern matches that are greater than the indicated projection threshold.
ProjectMax - The Project Average indicator returns the maximum of all projections (leads) of the projection series for all pattern matches that are greater than the indicated projection threshold.
ProjectStndDev - The Project Standard Deviation indicator returns the standard deviation of all projections (leads) of the projection series for all pattern matches that are greater than the indicated projection threshold.
ProjectRange - The Project Range indicator returns the range of all projections (leads) of the projection series for all pattern matches that are greater than the indicated projection threshold.
ProjectUpperB - The Project Upper Band indicator returns the upper envelope of all projections (leads) of the projection series for all pattern matches that are greater than the indicated projection threshold.
ProjectLowerB - The Project Lower Band indicator returns the lower envelope of all projections (leads) of the projection series for all pattern matches that are greater than the indicated projection threshold.
ProjectCount - Given a projection threshold, the Project Count indicator returns the total number of matches between the current pattern and patterns in history.
ProjectPercent - Given a projection threshold, the Project Percent indicator returns the percentage of total number of matches between the current pattern and patterns in history.
For more details, please view the product manual for this add-on.
BUY NOWThe Turning Points add-on for the NeuroShell Trader series is based on the concept of finding local peaks and valleys in a price series.
A turning point (TP) peak is defined as the point where the high is higher than or equal to any other highs in the neighborhood of the point. A turning point valley is defined as the point where the low is lower than or equal to any other lows in the neighborhood of the point.
The above definitions are illustrated by an example graph below.
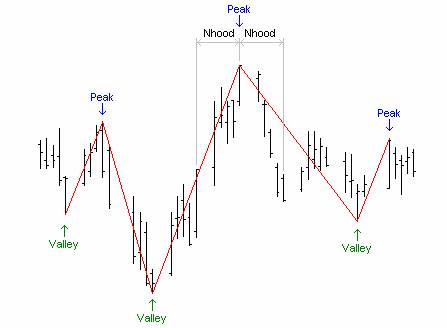
The add-on contains indicators that do all of the following with respect to these turning points:
We are especially fond of the probability indicators above, because many issues exhibit repeating cyclic tendencies which can be captured with this technique. Of course, news and other factors can affect normal cyclic tendencies, and not every trade generated will be correct. However, there is plenty of capability in this add-on to build trading strategies that even we haven't thought of yet.
Following is a complete list of the indicators in the Turning Points add-on:
The Turning Points add-on requires the NeuroShell Trader, NeuroShell Trader Professional, or NeuroShell DayTrader Professional, release 3.8 or better.
For more details, please view the product manual for this add-on.
BUY NOWCopyright © 1997 -
by Ward Systems Group, Inc.
All rights reserved.
