Four examples of how to use Cluster Indicators are called Cluster Example 1.cht, Cluster Example 2.cht, Cluster Example 3.cht, and Cluster Example 4.cht. The charts for the examples are installed in the "Cluster Examples" subfolder of the NeuroShell Trader folder. When you open the charts, you will be asked if you want to use the data saved in the charts. Select "yes" so you can see the same results. Cluster Example 1 In Cluster Example 1, we used Intel (INTC) daily stock prices. We built a simple trading strategy in which the same Cluster3 indicator was used in a long entry condition (rule), and another for short entry condition. There were no exit conditions; we reversed from a long to a short and vice versa. The actual conditions for both the long entry and the short entry were the same: the relational A<B indicator, where A was the Cluster3 indicator and B was allowed to vary from 0 to 1. Note that three standard indicators were used. Our indicator has an optimized scaling set which was allowed to vary between the last 10 to 100 bars. All results shown on the chart are out-of-sample backtest results. It is worth pointing out here that although the same A<B was selected for both the buy and sell rules, the trading strategy actually uses two copies of Cluster3 which it evolves differently. One evolves to predict long entry predictions, and another evolves to predict short entry predictions. We used the optimizer in the NeuroShell Trader Professional to find the parameters of the three inputs, as well as the scale period, and the cluster center coordinates C1, C2, and C3. We optimized over two years, and then backtested over the next 6 months. The results were a substantial improvement over buy and hold for both in-sample (optimization period) and out-of-sample (backtest period). Cluster Example 2 Cluster Example 2 is virtually the same as Cluster Example 1 except that we used General Motors (GM) stock prices instead of INTC, we used slightly different inputs, and we used ClusterC3 instead of Cluster3. We used the same backtest period. Cluster Example 3 Cluster Example 3 is very much like the first two examples with the following major exceptions: 1. We used Microsoft (MSFT) stock prices. 2. We used Cluster4 instead of Cluster3 or ClusterC3 for both the long entry and short entry rules. 3. We used a two year backtest period. 4. We used different commission prices and investment amounts. 5. We used a different objective function during optimization. Cluster Example 4 Cluster Example 4 is very much like the first three examples in terms of how we used the cluster indicators in trading strategies. However, we fed completely different indicators into the Cluster indicators. Instead of using the traditional price momentum type indicators, we used slopes of straight lines fit through different portions of the recent price curve. The figure below illustrates the concept:
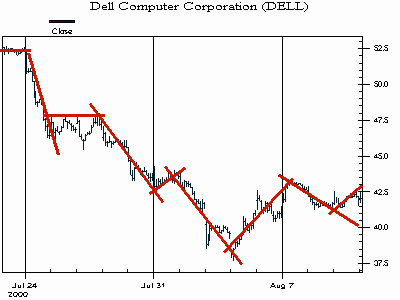
Many expert technical traders make position decisions based upon such trend lines placed through recent segments of the price curve. For many experienced traders, these trend lines don’t even need to be drawn. The human brain is capable of superimposing imaginary trend lines through price curves and then subconsciously comparing these trend lines to trend lines from previous situations. Those of us who are not expert technical traders lack the years of experience watching price movements. Our brains are not capable of placing these trend lines in the proper positions of the price curve, and have a limited database of previous trend line patterns with which to compare. However, some simple regression indicators combined with a powerful genetic algorithm optimizer can do the job for us. The NeuroShell Trader Professional and DayTrader Professional contain several types of linear regression indicators. One type is capable of placing imaginary line segments through various parts of a price curve and then reporting the slopes (angles) of these lines. A particular set of angles forms a pattern which can then be compared to future patterns to make trading decisions. But where should trend lines be placed and how long should they be? Genetic algorithms are great for figuring that out because of their ability to simultaneously optimize many variables. In our pattern recognition task, we’d like to find the optimal length and starting positions of trend lines. We didn’t use DELL, as depicted in the chart above. We used Texas Instruments (TXN). We used ClusterC4, into which we fed the regression slope indicators (see the Regression category). One regression indicator did not have a lag, but the other three did. We let the genetic algorithm optimizer find the lag periods and the length of the lines (regression period) at the same time it found the other factors for the Cluster indicator.
|