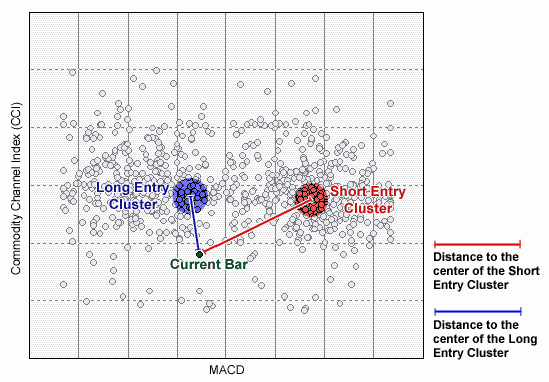
Overview The Cluster Indicators Add-On is based on how the human brain might classify the market, but it isn't even a neural network (although neural net enthusiasts will see this as similar to a Kohonen Self Organizing Map, trained by genetic algorithm!). Think about this. Suppose you have two good "inputs" (i.e., indicators). Now suppose you made a scatter plot (Figure 1) of a bunch of recent bars worth of these inputs. (For the mathematically minded, all recent bars are plotted with one input on the Y axis and the other on the X axis.) Now suppose the inputs are good, as defined by the fact that their patterns foretell an up-trend or a downtrend in the price. Then wouldn't the bars that precede an up-trend look somewhat similar, at least after they were "normalized"? Wouldn't those that precede a downtrend look similar too? In other words, wouldn't the buy bars cluster together and the sell bars cluster together?
Figure 1 – The chart displays long entry and short entry clusters for a Cluster Indicator based on the MACD and CCI indicators as inputs.
Cluster Indicators The Cluster Indicators tell you how far the current bar is from the cluster center of the recent "buy" bars or "sell" bars. The output is the distance normalized to be in the range from zero to around one. Now expand the concept to as many as 16 inputs. Those can't be plotted because you'd need a 16 dimensional scatter plot. But you can still measure how close the current bar is to a 16 dimensional cluster center! There are 15 Cluster Indicators named Cluster2, Cluster3, …, Cluster16. These indicators require from two to 16 input variables respectively. Cluster Indicators with Contribution Factors Let's carry the concept a little further. Suppose some of the inputs are less effective than others in determining whether there is a buy or sell situation. You wouldn't want to consider less effective inputs as much as the others when determining clusters and "closeness". No problem, we have 8 Cluster "Contribution" Indicators, each of which has contribution factors which reduce or increase the impact of an indicator. You can set these contribution factors yourself or you can let the genetic algorithm do it for you. Either way, you now have a more powerful clustering indicator. The 8 Cluster Indicators with contribution factors are named ClusterC2, ClusterC3, …, ClusterC9, taking from two to nine input variables respectively. How to Use Cluster Indicators Effectively We believe that using Cluster Indicators with fewer inputs will more likely result in models that are more robust when applied to future data. Where to Find Cluster Indicators All Cluster Indicators are found in the Clustering category of indicators in the Indicator Wizard. Requirements Because the Cluster Indicators require the use of the genetic optimizer to find the appropriate cluster center, the user must either have the NeuroShell Trader Professional or NeuroShell DayTrader Professional.
|