In theory, trading with cycles is easy - just buy at the valley and sell at the crest. This is just a variation of the old buy-low, sell-high dictum. In practice, trading with cycles is far more difficult. Just for openers, the very existence of market cycles is ephemeral and one must jump on them quickly to take advantage of any market inefficiency that they represent. In addition, there are a number of other conditions that make trading with cycles more difficult, perhaps to the point that the real question is "when should I NOT trade with cycles?" The most significant among these conditions are signal to noise ratios, being swamped by the trend, and trend persistence.
Signal to Noise Ratio (SNR)
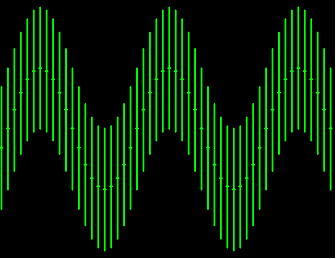
One of the purposes of measuring the market cycle is to determine market inefficiency because of a short term coherence. That is, if there is a coherence in prices, we can expect that coherence to continue - at least for a short while into the future. We can then identify this cycle component as the "signal" we are trying to exploit. On the other hand, the market is comprised of a large number of traders with diverse objectives. If we are looking for a cycle period on the order of a month, for example, then the daily fluctuation in price is "noise" that can interfere with our signal. In this sense we can define the range of a given price bar from low to high as noise. If the noise amplitude is equal to the peak amplitude of the cycle, then we have the theoretical case displayed in the following figure.
0 dB SNR
This is called 0 dB SNR, when the noise amplitude is equal to the signal peak amplitude. (A decibel, or dB is a logarithmic ratio of their respective powers.) Murphy's Law being what it is, we could have our cycle measured perfectly so that we entered the trade at the valley of the cycle and exited the trade at its crest and still just have a break even profit. This occurs if we entered the long position (at the valley) at the high of the bar and exited the position at the crest, but at the low of that bar. So, 0 dB SNR defines a case where it is unlikely to make a profit because it is unlikely you will always know the cycle exactly.
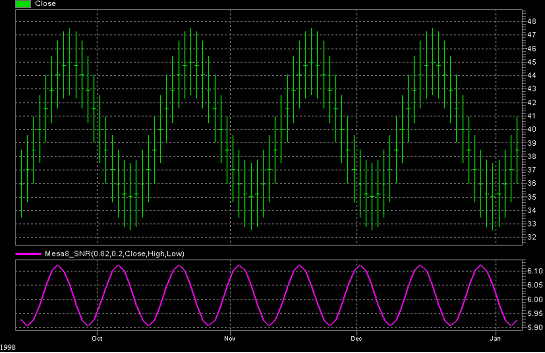
A defining case for a minimum signal to noise ratio is 6 dB SNR, where the signal peak amplitude is twice the noise amplitude (a better time to trade). The theoretical 6 dB MESA8 SNR case (purple line) is shown in the following figure.
6 dB SNR
The profit one can realize in the noise-free case can be seen as the difference between the tick at the center of the highest bar and the tick at the center of the lowest bar. The profit one can expect to realize due to noise in this case is exactly half the profit one would obtain in the noise free case. We find this is a workable definition for the minimum signal to noise ratio that can be used when trading the cycle.
Trend Swamping
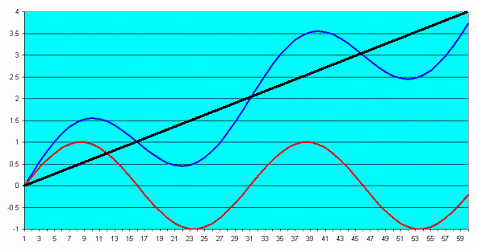
It is possible that a perfectly measured cycle indicates that the correct trade at the moment is to go short. On the other hand, if the market is in a massive bull trend, it is easily possible that the trend is so strong that it completely negates the advantage of the cyclic trade. A limiting case for trading cycles within a trend is shown in the following figure.
Trend-Limiting Case for Trading Cycles
The theoretical cycle is shown as the red curve, and would have a profit of 2 if the trade was to sell short at the crest and exit at the valley. The theoretical trendline is shown as the straight black line, and has a slope exactly equal to twice the peak amplitude of the cycle (or equal to the peak-to-peak amplitude, if you prefer). Assuming a model where the cycle component and trend component are added together to form a composite waveform, the theoretical model price is shown as the blue line. Following an identical strategy of selling short at the crest and exiting at the valley, the profit is now approximately half the profit that was realized in the absence of the trend. We find that the definition for trend swamping is when the trend slope across the period of the cycle exceeds twice the cycle amplitude is workable.
Trend Persistence
As shown in the previous chart, one expects the cycle component of the market to criss-cross the trend component approximately every half cycle. As a practical matter, there are times when the price stays on one side of the "instantaneous trendline" (MESA8 Trend) for an extended period of time. This usually happens when the cycle amplitude is relatively small. We find it helpful to avoid trading the cycles when the price has not crossed the instantaneous trendline within the last half cycle.
Cycle Trading Indicators
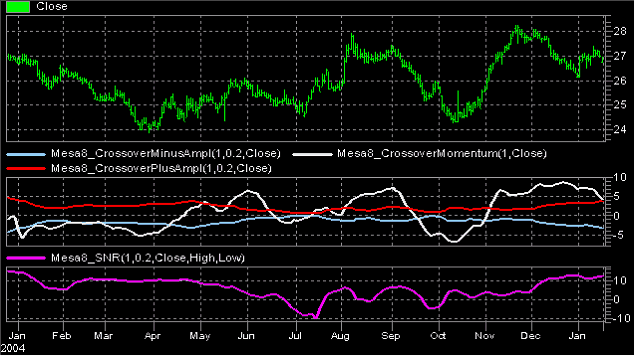
In MESA8 we accurately measure the cycle period, show the cycle and instantaneous trend components. We also consolidate the conditions under which one should trade the cycle mode or the trend mode of the market. The following figure shows these components in a real-world example of the MSFT for the year 2005.
Trading Mode
The first subgraph below the price bars shows the three components of the MESA8 Crossover indicator: MESA8 Crossover Momentum (white line), MESA8 Crossover Plus Amplitude (red line) and MESA8 Crossover Minus Amplitude (blue line). The MESA8 Crossover indicator shows the trend swamps the cycle amplitude for most of the year with the exception of parts of January, February, June, and July (the CrossoverMomentum indicator is outside the Crossover Plus Amplitude and Crossover Minus Amplitude indicators for most of the year). Therefore, trading using oscillators should have been avoided most of the time for this reason. Further, the MESA8 SNR is less than 6 dB during these periods, as shown in the bottom subgraph. As a result, MSFT should have been traded using only trend mode type indicators during 2005.
|