MESA8 is as easy to use as any of the indicators built into NeuroShell Trader. As opposed to fixed rule indicators, all MESA indicators dynamically adjust to current market conditions.
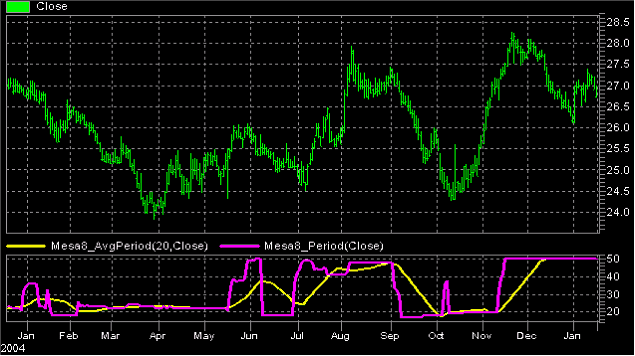
The premise of MESA is that market cycles are the one characteristic that can be scientifically measured. The MESA (Maximum Entropy Spectral Analysis) algorithm makes a high resolution estimate of the entire range of potential cycles. Experience has shown that there is typically only one tradable cycle in the market at a time. This is the "dominant cycle" that is extracted from the spectral estimate by using a center of gravity approach so that the dominant cycle is the one containing the majority of the cyclic power. A real-world example of the spectrum as measured by MESA8 is shown in the following figure for MSFT for the year 2005. There is a monthly (20 bar) cycle during the first third of the year with heavy trending during the rest of the year, shown by the existence of the longer cycle periods. There was an attempt to reestablish a monthly cycle in the early Fall. Both the fast measurement (pink line MESA8 Period) and the smoothed value of the dominant cycle (yellow line MESA8 AvgPeriod) are displayed in the subgraph.
MESA8 Dominant Cycles for MSFT in 2005
Notice that the dominant cycle is ephemeral - it comes and goes, sometimes very quickly. MESA8 provides the dominant cycle as an output that enables other indicators to be adaptive to current market conditions. The smoothed dominant cycle indicator also enables you to smooth the dominant cycle measurement with any degree of smoothing you desire.
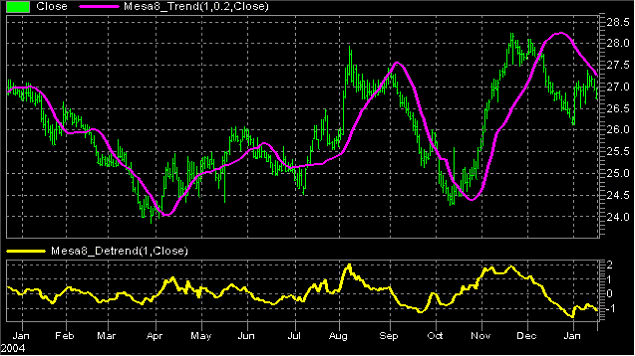
Since there is typically only a single tradable dominant cycle present at a time, a simplified model of the market consisting of just a trend and a cycle seems reasonable. With this, we can build trading strategies based on the premise of a trend mode and a cycle mode. The trend is just the difference between the current price and the price one cycle period ago. Since the cycle period is known, we therefore know the trend. The trend can be measured by taking a Simple Moving Average whose length is the period of the dominant cycle. This completely removes the cycle component because there are as many sample points above the average as below the average - thus the trend component is revealed. However, taking the Simple Moving Average introduces a lag in the trend equal to half the dominant cycle period. If the trend is horizontal this is no problem, but does represent a distortion in both bull and bear trends. This distortion can be compensated by adding half the "momentum" across the cycle period to the Simple Moving Average. This compensation adds a vertical displacement which, in theory, compensates for the lateral displacement of the lag. The "instantaneous trendline" (pink line MESA8 Trend) produced by MESA8 is shown in the following figure.
MESA8 Instantaneous Trendline and Detrended Data
Computed this way, the instantaneous trendline forms the mean value of the prices, around which the cycle component swings. The detrended price (yellow line MESA8 Detrend) is computed by subtracting the instantaneous trendline from the prices. In the figure above, MESA8 scales the detrended price to the +1 sigma and -1 sigma values (plus and minus one standard deviation) for you to easily visualize when the prices can be expect to revert to the mean.
TRADE THE TREND?
It is not advisable to trade cycles if the cycle amplitude is swamped by the trend or if the signal to noise ratio is so low that profit expectation is diminished significantly.
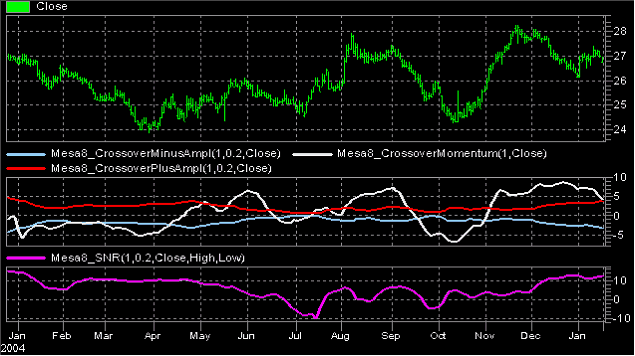
The first subgraph below the price bars shows the three components of the MESA8 Crossover indicator: MESA8 Crossover Momentum (white line), MESA8 Crossover Plus Amplitude (red line) and MESA8 Crossover Minus Amplitude (blue line). The MESA8 Crossover indicator shows the trend swamps the cycle amplitude for most of the year with the exception of parts of January, February, June, and July. Therefore, trading using oscillators should have been avoided most of the time for this reason. Further, the Signal to Noise Ratio (pink line SNR) is less than 6 dB during these periods, as shown in the bottom subgraph. As a result, MSFT should have been traded using only trend mode type indicators during 2005.
Crossover and SNR Indicators
Cycle Quality
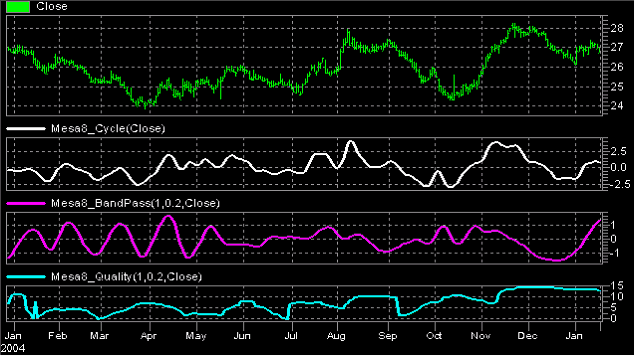
Returning to the cyclic component, the figure below shows several aspects of MESA8. The first subgraph (white line MESA8 Cycle) shows all the cycle components in the data by highpass filtering (passing all the cycle periods shorter than 40 bars). The second subgraph shows the bandpass filtered data (pink line MESA8 BandPass), where the center of the passband is tuned to the dominant cycle. Note the two curves are only vaguely similar across the chart, which is a sign that the cyclic activity is not concentrated at the dominant cycle. The third subgraph (blue line MESA8 Quality) displays the root mean squared (RMS) error across the dominant cycle period in terms of decibels from 0.1%. The error is the difference between all of the cycles and the bandpass filtered cycle. Errors greater than 0.1% indicate there is substantial cyclic power outside the band near the dominant cycle. For example, if the cyclic error is greater than 0.1%, then you can trade the cycle mode (with a nonlinear oscillator such as Stochastic RSI, but using the basis other than the dominant cycle). A high error can mean the dominant cycle measurement could be incorrect or that cycle energy is scattered. The error can be another way to judge whether to trade in the cycle mode.
MESA 8 Cyclic Indicators
Sinewave
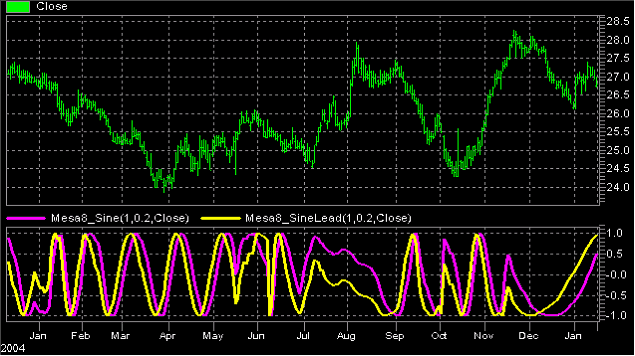
The problem with virtually all indicators is that they are causal. That means they directly depend on data for their computation. As a result, the computation cannot be accomplished until after the data arrives, and - as a result - all causal indicators have lag. Lag is perhaps the traders' worst enemy, particularly when trading the cycle mode when relatively short term entries and exits are expected. MESA8 offers a solution to the lag problem by offering the MESA8 Sine and SineLead indicators. The market is coherent in the cycle mode, meaning that the dominant cycle has existed for a short while in history. It is further assumed that the dominant cycle will continue for a short time into the future. Since the dominant cycle is known, and its phase can be computed, we can advance time by advancing phase of the coherent dominant cycle. The MESA8 Sine indicator (pink line) shown in the figure below is computed using the phase of the dominant cycle. The MESA8 SineLead indicator (yellow line) is computed simply by advancing the phase of the dominant cycle by 45 degrees. This creates an indicator that produces a crossing signal 1/8th of a cycle ahead of its turning point. For an 16 bar cycle, the crossing occurs 2 bars ahead of the cyclic turning points - just right for making a timely trade entry. Clearly, the MESA8 Sine and MESA8 SineLead indicators do not work so well when the market is in a trend mode.
MESA8 Sinewave Indicator
|